 Permanecer
Condiciones de negociación
Products
Herramientas


Trend analysis
In June, EUR/USD is expected to develop the upward move with the first target at 1.1167 that is 61.8% retracement (the blue dotted line). In case this line is breached, the second upward target will be 1.1275 that is 76.4% retracement (the blue dotted line). The final target of the month is seen at 1.1371 (the red bold line). From that level, it would be a nice idea to trade downwards with the first downward target of 1.1178-21 that is an emerging moving average (the black thin line).
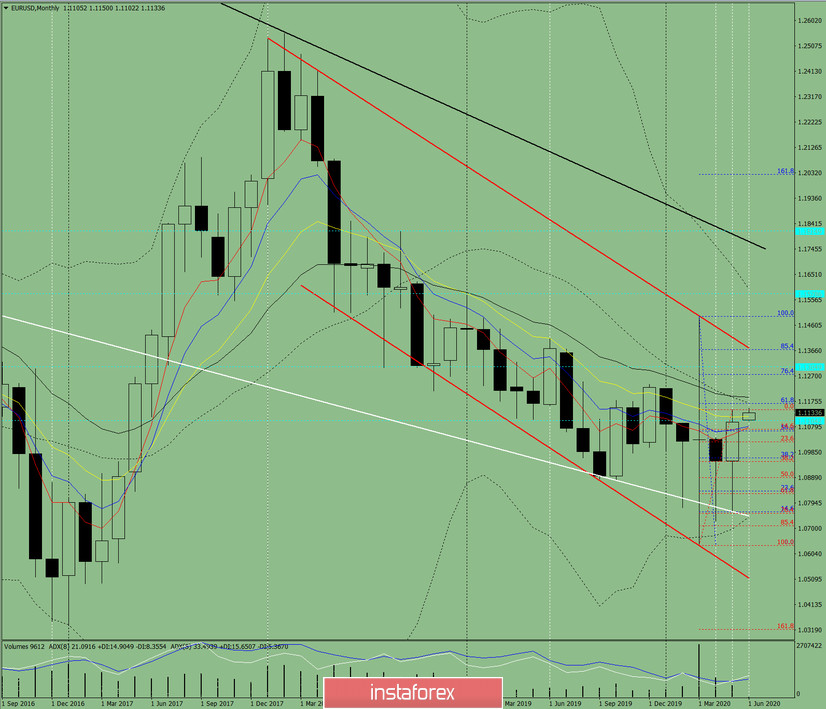
Fig 1 (a one-month chart)
Indicator analysis
Conclusion from complex analysis. The most probable scenario is the uptrend.
Let's figure out the EUR/USD candlestick according to a one-month chart. The price is likely to trade higher amid the lack of the first lower shade (the upper shade on the first week of June) of a one-week white candlestick. Another thought is the lack of the second upper shade (the white candle on the final week).
The most plausible upper scenario. The May candlestick closed at 1.1099. From this level, the upward target is set at 1.1275 that is 76.4% retracement level (the blue dotted line).
The least plausible lower scenario. From the level of 1.1099, traders might plan deals downwards with the target of 1.1072 that 14.6% retracement level (the red dotted line). The next downward target is 1.1023 that is 23.6% retracement level (the red dotted line).
¡Los informes analíticos de InstaForex lo mantendrá bien informado de las tendencias del mercado! Al ser un cliente de InstaForex, se le proporciona una gran cantidad de servicios gratuitos para una operación eficiente.


