 Permanecer
Condiciones de negociación
Products
Herramientas


Trend analysis.
In July, an upward movement from the level of 1.2397 (closing of the June monthly candle) is possible with the first goal of 1.2717 – a pullback level of 61.8% (red dotted line). If this level is broken up, the next upper target is 1.2992 - resistance line (red bold line).
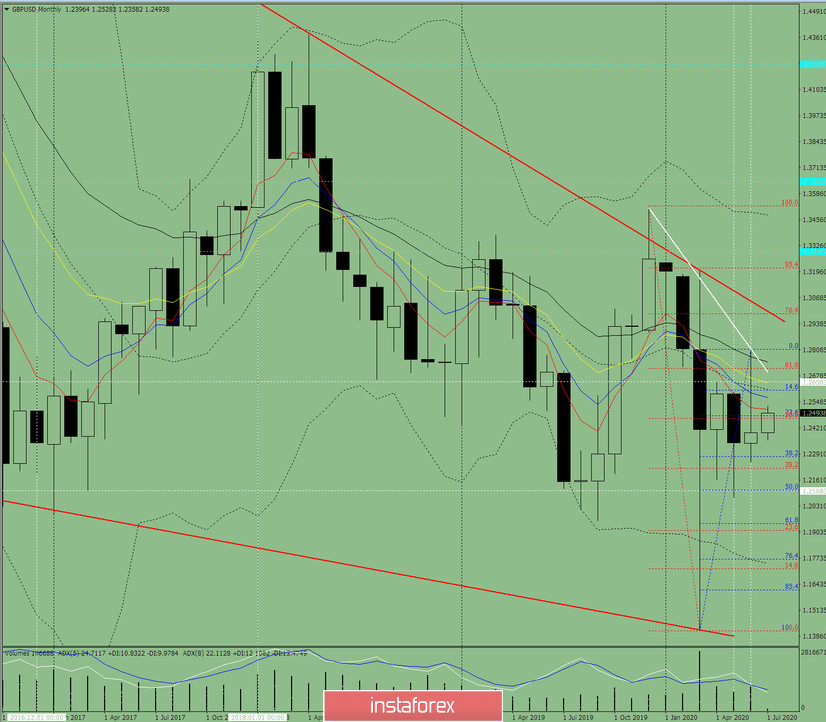
Fig. 1 (monthly chart).
Indicator Analysis:
- indicator analysis - up;
- Fibonacci levels - up;
- volumes - up;
- candlestick analysis - up;
- trend analysis - down;
- Bollinger Lines - down;
Conclusion on a comprehensive analysis - the upper hand is possible.
The total result of calculating the candle of the GBP/USD currency pair according to the monthly chart: the price will most likely have an upward trend with the absence of the first lower shadow (the first week of the month is white) for the monthly white candle and the presence of the second upper shadow (last week is black).
The upper scenario: an upward movement with the first target of 1.2717 from the level of 1.2397 (closing of the June monthly candle) is possible - a pullback level of 61.8% (red dashed line). If this level is broken up, we will continue to the next upper target 1.2992 - resistance line (red bold line).
An unlikely scenario: after working up and reaching a pullback level of 50.0% - 1.2467 (red dashed line), working down to the pullback level of 38.2% -1. 2276 (blue dotted line) is unlikely. From this level, we can continue to the downward movement with the goal of 1.2028 - 50% pullback level (blue dotted line).
¡Los informes analíticos de InstaForex lo mantendrá bien informado de las tendencias del mercado! Al ser un cliente de InstaForex, se le proporciona una gran cantidad de servicios gratuitos para una operación eficiente.

