 Permanecer
Condiciones de negociación
Products
Herramientas


GBP/USD
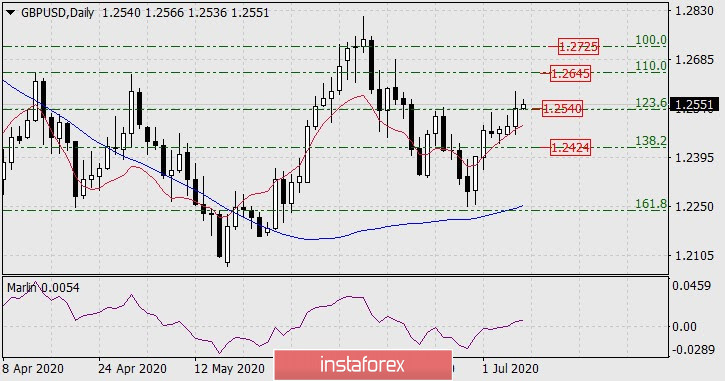
The pound successfully overcame the resistance of the 123.6% Fibonacci level at 1.2540 yesterday. The Marlin oscillator has invaded growth territory on the daily chart. The price is directly held by the balance indicator line. Now the nearest target of the pound is the Fibonacci level of 110.0% at the price of 1.2645. Overcoming this level opens the second target for the Fibonacci level of 100.0% (February 28 low) at the price of 1.2725.
The price was pinned above the Fibonacci level of 123.6% on the four-hour chart, the signal line of the Marlin oscillator turned up from the border of the negative trend zone – the market is set to grow further.
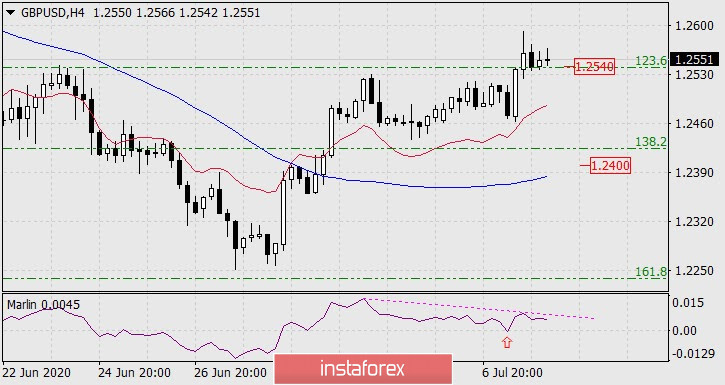
The following circumstance can prevent growth – a divergence with the price is formed on the Marlin, and the signal line leaving to the negative zone will finally form it. In this case, we expect the pound to fall to support the MACD line (1.2400), just below the Fibonacci level of 138.2%. In turn, pinning the price below the Fibonacci level of 138.2% will indicate the intention to overcome the support of the indicator line and move deeper down to the Fibonacci level of 161.8%, in the area of the MACD line on the daily chart.
It is possible for growth to resume after overcoming yesterday's high of 1.2591.
¡Los informes analíticos de InstaForex lo mantendrá bien informado de las tendencias del mercado! Al ser un cliente de InstaForex, se le proporciona una gran cantidad de servicios gratuitos para una operación eficiente.

