 Permanecer
Condiciones de negociación
Products
Herramientas


Trend analysis.
This week, the price from the level of 1.2619 (closing of the last weekly candle) will move up with the goal of reaching the resistance line - 1.2758 (red bold line). If this line is reached, it is possible to work down with the target at 1.2566, the pullback level is 38.2% (blue dashed line).
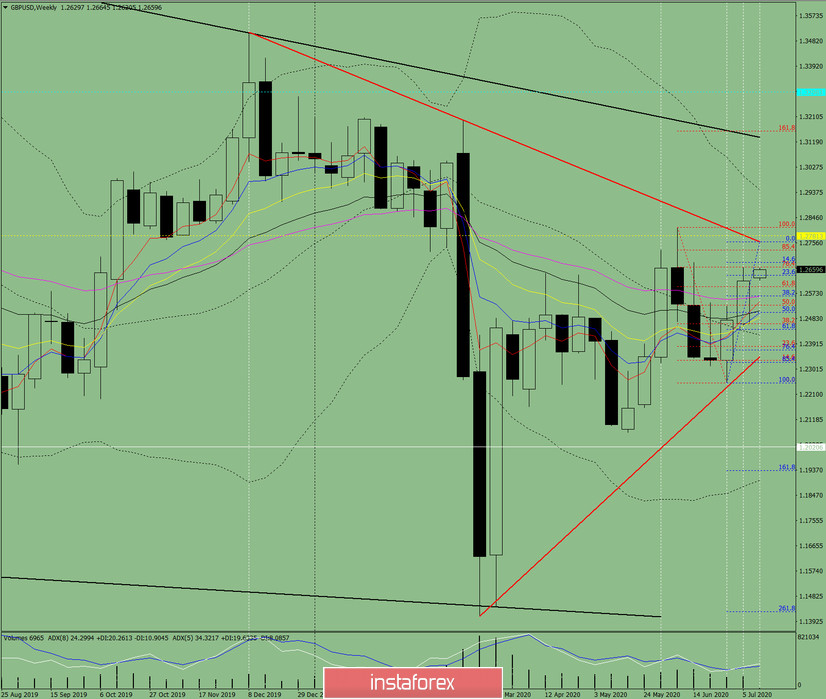
Fig. 1 (weekly schedule).
Comprehensive analysis:
- indicator analysis - up;
- Fibonacci levels - up;
- volumes - up;
- candlestick analysis - up;
- trend analysis - up;
- Bollinger Lines - top;
- monthly chart - up.
The conclusion of a comprehensive analysis is an upward movement.
The overall result of calculating the candle of the GBP/USD currency pair according to the weekly chart: the price of the week is likely to have an upward trend with the absence of the first lower shadow of the weekly white candlestick (Monday - up) and the absence of the second upper shadow (Friday - up).
The first upper target is to reach the resistance line - 1.2758 (red bold line). If this line is reached, it is possible to work down with the target at 1.2566, the pullback level is 38.2% (blue dashed line).
An unlikely but possible scenario: when moving up and reaching the resistance line - 1.2758 (red bold line), the price can continue to move upwards in order to reach the upper border of the Bollinger line indicator - 1.2972 (black dashed line).
¡Los informes analíticos de InstaForex lo mantendrá bien informado de las tendencias del mercado! Al ser un cliente de InstaForex, se le proporciona una gran cantidad de servicios gratuitos para una operación eficiente.


