 Permanecer
Condiciones de negociación
Products
Herramientas


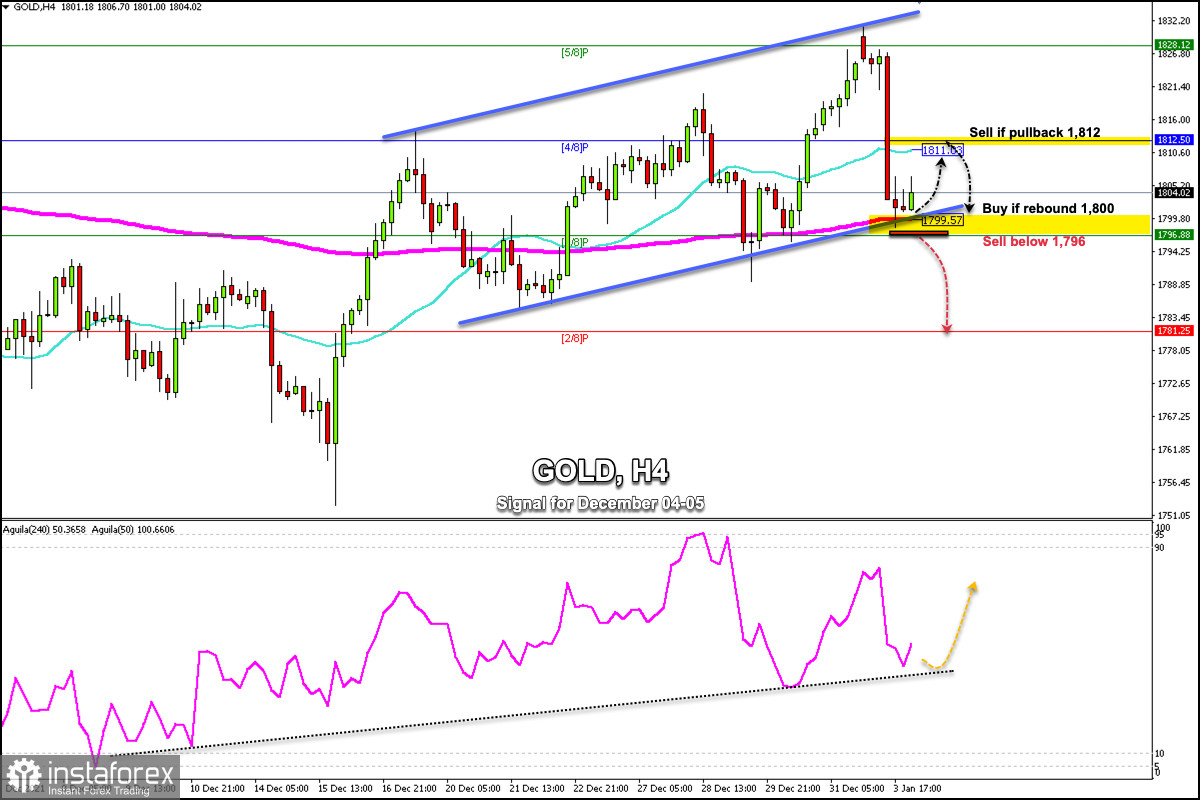
In the last few hours, gold has fallen due to rising yields of the US 10-year treasury bonds. The yield they reached was 1.617%, which represents a maximum of several months. As gold has a negative correlation with bonds, it is expected to trade under downward pressure in the next few days, only if the price is below 1,812.
The 4-hour chart shows that gold has fallen below the 21 SMA and is approaching the 200 EMA, reflecting that bearish pressure could break the key support of 1,800.
Meanwhile, the eagle indicator is moving above its uptrend channel, which is a positive sign for gold. The price could have a recovery as long as it remains above the 200 EMA (1,800).
The 4-hour chart shows an immediate resistance at 1,812 where there is also the 21 SMA. A pullback towards the resistance of 4/8 of Murray could be an opportunity to sell with targets at the bottom of the uptrend channel.
The strength of the uptrend channel formed since December 16 has been tested and gold is bouncing above it. It is expected to trade within the price range between 1,812-1,800 in the next few hours.
Our trading plan is to buy above the 200 EMA with targets at 1,812. Sell if gold is unable to break the 4/8 Murray line with targets at 1,800, and if the downward pressure breaks the 200 EMA, we should sell with the target at 1,781.
Support and Resistance Levels for January 04 - 05, 2022
Resistance (3) 1,828
Resistance (2) 1,822
Resistance (1) 1,810
----------------------------
Support (1) 1,796
Support (2) 1,789
Support (3) 1,775
***********************************************************
Sell in case of pullback 1,812 (21 SMA - 4/8) with take profit at 1,800 (200 EMA) and 1,781 (2/8), stop loss above 1,817.
¡Los informes analíticos de InstaForex lo mantendrá bien informado de las tendencias del mercado! Al ser un cliente de InstaForex, se le proporciona una gran cantidad de servicios gratuitos para una operación eficiente.


