 Permanecer
Condiciones de negociación
Products
Herramientas


Trend analysis (Fig. 1).
The market may begin to move downward from the level of 1.3077 (closing of yesterday's daily candle) with the target of 1.3037 - a 14.6% pullback level (red dotted line). From this level, the downward trend may continue with the next target of 1.2953 - a 23.6% pullback level (red dotted line).
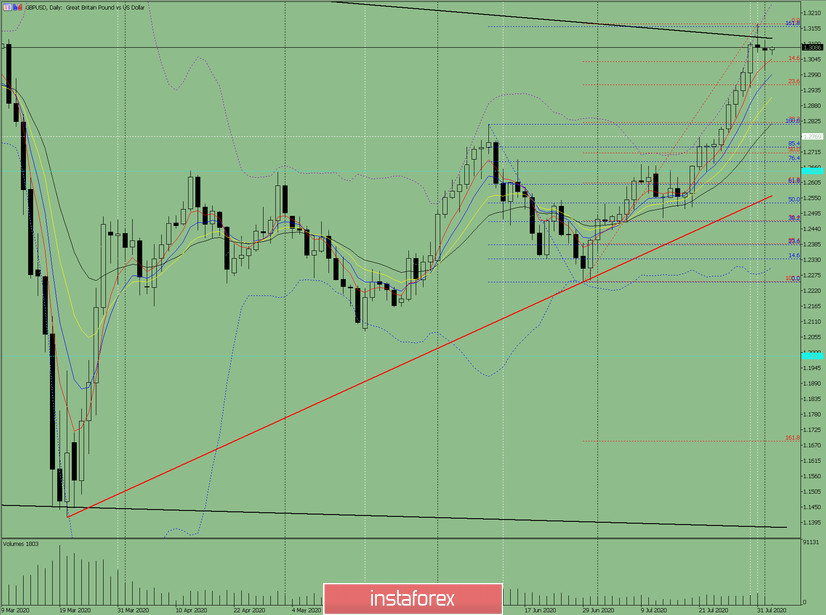
Fig. 1 (daily chart).
Comprehensive analysis:
- Indicator analysis - down;
- Fibonacci levels - down;
- Volumes - down;
- Candlestick analysis - down;
- Trend analysis - down;
- Bollinger lines - down;
- Weekly chart - down.
General conclusion:
Today the price may begin to move downward from the level of 1.3077 (closing of yesterday's daily candle) with the target of 1.3037 - a 14.6% pullback level (red dotted line). From this level, the downward trend may continue with the next target of 1.2953 - a 23.6% pullback level (red dotted line).
Another possible scenario is upon reaching the level of 1.3077 (closing of yesterday's daily candle) the upward movement may continue with the next target of 1.3161 - a 161.8% target level (blue dotted line).
¡Los informes analíticos de InstaForex lo mantendrá bien informado de las tendencias del mercado! Al ser un cliente de InstaForex, se le proporciona una gran cantidad de servicios gratuitos para una operación eficiente.


