 Permanecer
Condiciones de negociación
Products
Herramientas


Hello, dear colleagues!
Despite the damage suffered by the Eurozone economy due to the COVID-19 pandemic, the business environment in Germany and the Eurozone improved more than analysts' forecasts. Thus, the index of business sentiment from the ZEW Institute in Germany was 71.5 (forecast 58), and in the Eurozone, the same index rose to 64, while the previous indicator was at the level of 59.6.
At the same time, producer prices in the United States were also better than forecast. All figures for these and other indicators can be found in the economic calendar. Thus, all yesterday's macroeconomic reports from the Eurozone and the US were in the green zone, which introduced some uncertainty in the ranks of market participants and in the price movement of the main currency pair of the Forex market.
Daily
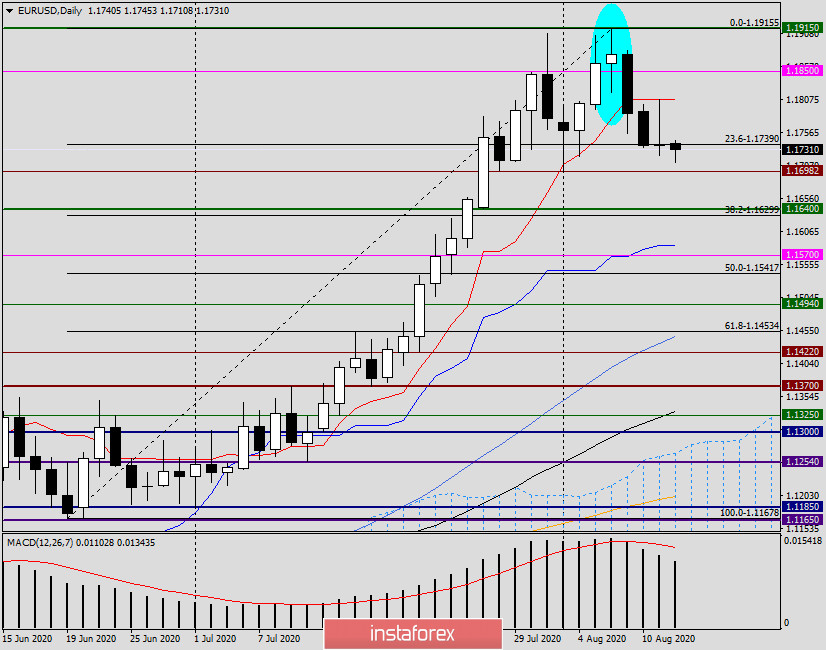
However, statistics remain statistics. Technical factors have not been canceled and they were decisive in yesterday's trading for EUR/USD. However, not only in yesterday's markets, I have always given preference to technology, and it is practiced much more often and more reliably than macroeconomic statistics. This trend is especially true in recent times, when fundamental factors are often simply ignored by market participants. To a much lesser extent, this situation is observed with the technical component.
So, yesterday's assumption that the pair will meet strong resistance near 1.1800, where the Tenkan line of the Ichimoku indicator passes, and recommendations to try selling from here, turned out to be absolutely correct. Euro bulls intended to return the quote to growth, but, meeting strong resistance from sellers at 1.1807, retreated. The bears returned the course to the opening price on August 11, and as a result, a disembodied Doji candle with a much longer upper shadow appeared on the daily chart. In my personal opinion, such a candle signaled the current weakness of buyers and the inability of bulls for the euro/dollar to continue the rise of the quote.
At the time of writing, EUR/USD is showing a slight decline and is trading near 1.1712. I believe that today the support around 1.1700 will be tested for strength. If sellers manage to rewrite the trading lows on August 3, at 1.1698, their next targets will be 1.1640, 1.1600 and 1.1585, where the Kijun blue line runs. If there are bullish reversal candles near the listed levels, it is possible that another attempt by the players to increase the euro exchange rate to resume the upward movement is possible. However, given the strength of resistance provided by the Tenkan line, this will be very problematic. Only the closing of trades above Tenkan and 1.1807 will return the relevance of the bullish scenario for the main currency pair. For now, the downward direction of the instrument looks more real.
H4
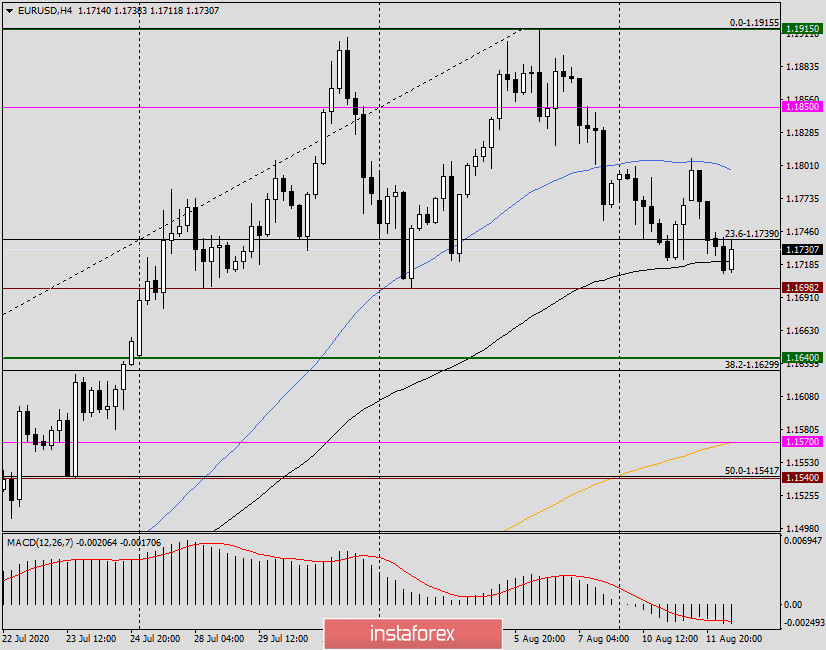
In this timeframe, we see that attempts to grow were stopped by the 50 simple moving average (1.1797), after which the pair turned to decline and at the moment of completion of the article tests the black 89 exponential moving average for a break. If the price breaks through 89 EMA and supports 1.1698, on the pullback to the broken level and 89 exponent, you can try to sell the pair with the nearest goal of 1.1640. As mentioned above, the longer-term goals of sellers will be 1.1600 and 1.1585.
H1
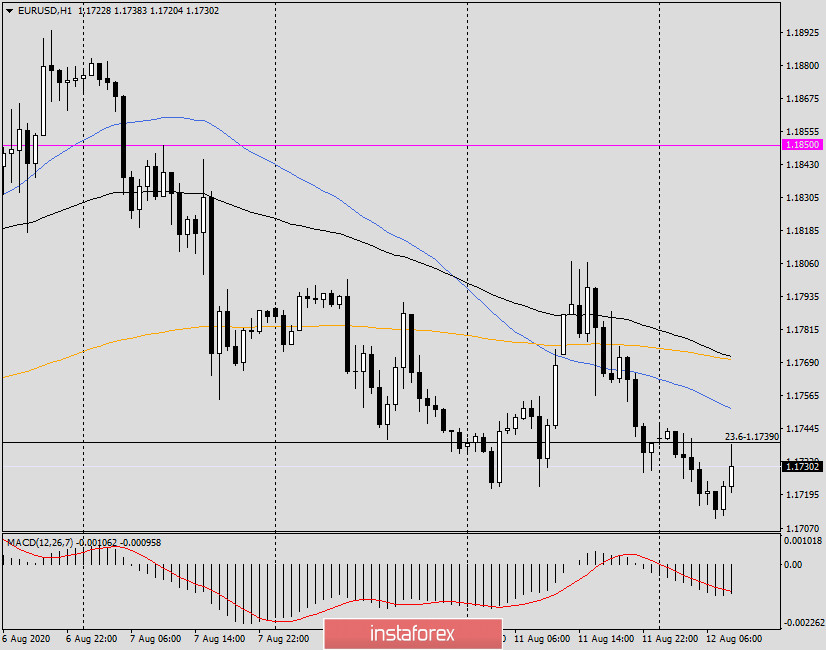
At more favorable prices, opening short positions on EUR/USD looks good on the rollback to the already broken hourly 50 MA, 200 EMA and 89 EMA, from the price zone of 1.1750-1.1770.
To open long positions, you need to wait for the corresponding candlestick analysis models near 1.1700 or in the support zone of 1.1640-1.1600. However, the main trading recommendation, in my personal opinion, should be considered sales.
It should be noted that important statistics from the Eurozone and the US are expected today, which may make changes to this forecast for EUR/USD. At 10:00 (London time), the Eurozone will publish data on industrial production for July. In turn, the United States will report on consumer prices at 13:30 (London time). Given investors' fears that the world's leading economy will recover more slowly due to the effects of COVID-19, the consumer price index is a very important macroeconomic indicator. When opening transactions for EUR/USD, I recommend taking into account the fundamental component.
Good luck!
¡Los informes analíticos de InstaForex lo mantendrá bien informado de las tendencias del mercado! Al ser un cliente de InstaForex, se le proporciona una gran cantidad de servicios gratuitos para una operación eficiente.

