 Permanecer
Condiciones de negociación
Products
Herramientas


To open long positions on EUR/USD, you need:
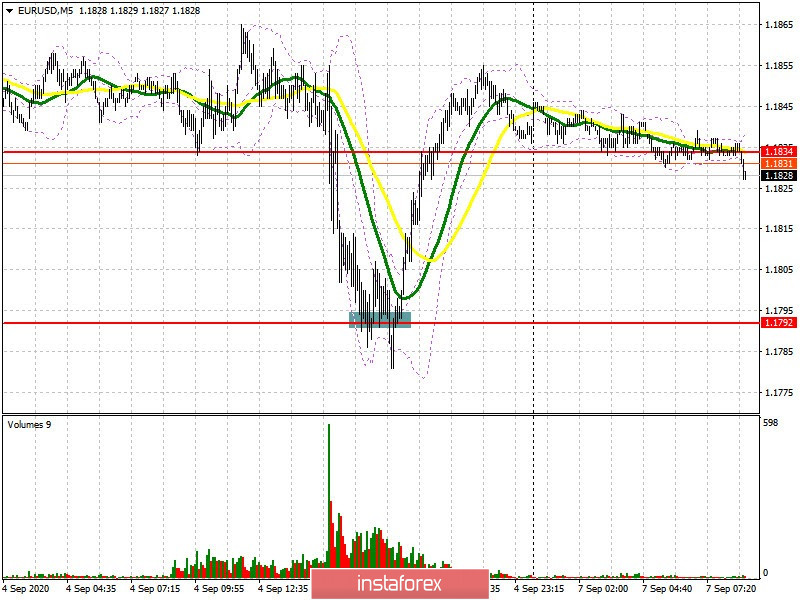
A buy signal formed from a large support level of 1.1792 last Friday afternoon, following the release of a fairly positive report on the US labor market, which I focused on in my review. If you look at the 5-minute chart, you can see how the bulls formed a false breakout in this range, which caused the pair to sharply rise towards the end of the session and return to the 1.1834 area, which is where the market closed. The situation has slightly changed at the moment, but the large support level of 1.1792 remains in place. The primary task of the euro buyers is to break out and settle above the 1.1853 resistance, which creates a signal to buy the euro with the goal of returning to the 1.1905 high, where I recommend taking profits. In case EUR USD repeatedly falls to the support area of 1.1792, it is best to open long positions from this range after forming a false breakout. I recommend buying the euro immediately on a rebound from the low of 1.1755, counting on a correction of 20-30 points within the day.
To open short positions on EUR/USD, you need:
Sellers need to protect resistance at 1.1853 today. It is quite possible to do this, since we do not have any important fundamental data for the day, and the United States will also be celebrating Labor Day, which will result in the closure of most markets. Forming a false breakout at the 1.1853 level will be a signal to sell the euro in order to return to the support of 1.1792, since it will be quite problematic to break through the area below this level. If this happens, we can expect a sharper fall from EUR/USD towards lows of 1.1755 and 1.1714. In case bears are not active at 1.1853, it is best to postpone short positions until the high of 1.1905 has been updated, counting on a correction of 20-30 points within the day.
Indicator signals:
Moving averages
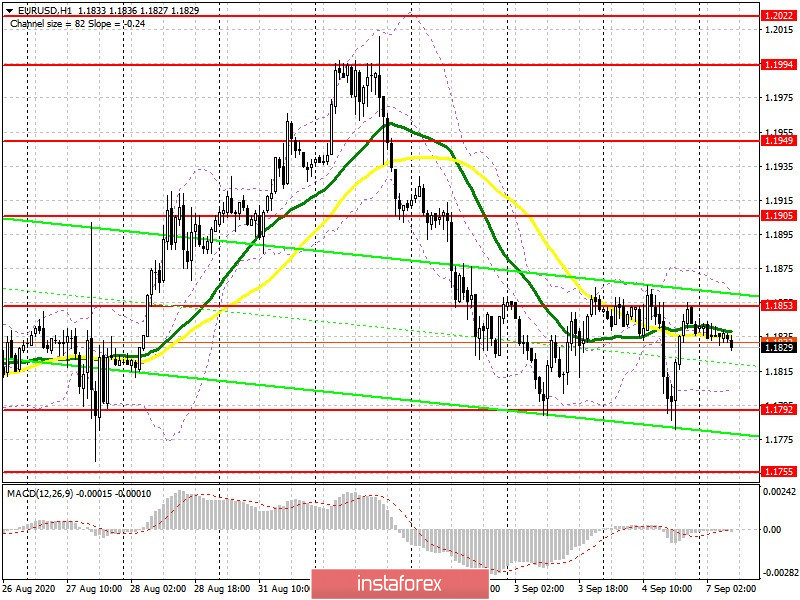
Trading is carried out just below the 30 and 50 moving averages, which indicates further market uncertainty due to the US holiday.
Note: The period and prices of moving averages are considered by the author on the H1 hourly chart and differs from the general definition of the classic daily moving averages on the daily D1 chart.
Bollinger Bands
In case the pair falls, support will be provided by the lower border of the indicator around 1.1805. Growth will be limited by the upper level of the indicator in the 1.1860 level.
Description of indicators
¡Los informes analíticos de InstaForex lo mantendrá bien informado de las tendencias del mercado! Al ser un cliente de InstaForex, se le proporciona una gran cantidad de servicios gratuitos para una operación eficiente.


