 Permanecer
Condiciones de negociación
Products
Herramientas


The pair traded downward on Wednesday and tested the support level 1.2885 (red bold line) and went up, closing the day with a white candle. Today, the price may continue to move up. Economic calendar news for the dollar is expected at 12:30 and 15:00 UTC.
Trend analysis (Fig. 1).
The market may continue to move upward from the level of 1.3002 (closing of yesterday's daily candlestick) with the target of 1.3138 - a 21-day EMA (black thin line). In case of testing this level, the upward trend may continue with the next target of 1.3209 - an 85.4% pullback level (blue dotted line).
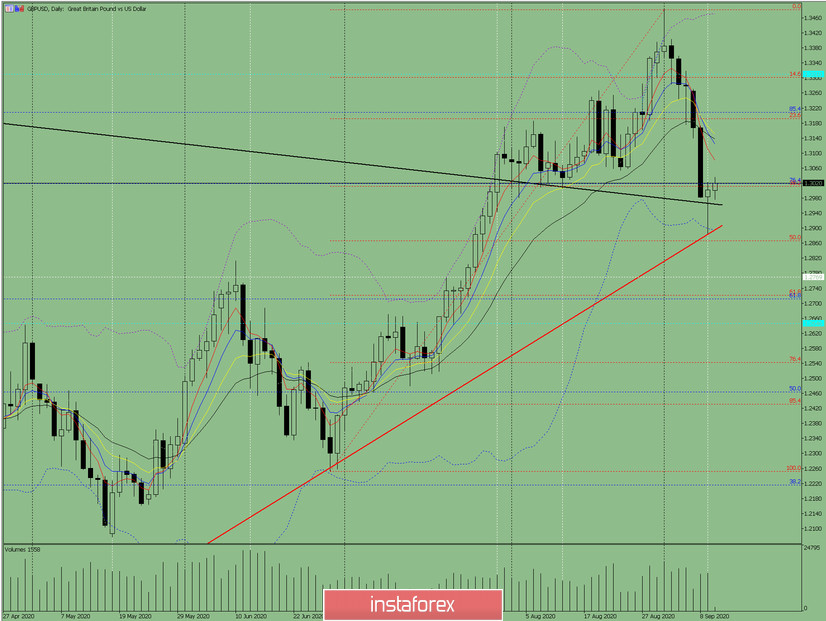
Figure: 1 (daily chart).
Comprehensive analysis:
- Indicator analysis - up;
- Fibonacci levels - up;
- Volumes - up;
- Candlestick analysis - up;
- Trend analysis - up;
- Bollinger lines - up;
- Weekly chart - up.
General conclusion:
Today, the price may continue to move upward with the target of 1.3138 - a 21-day EMA (black thin line). In case of testing this level, the upward trend may continue with the next target of 1.3209 - an 85.4% pullback level (blue dotted line).
Another possible scenario is from the level of 1.3002 (closing of yesterday's daily candle), the price may move downward with the target at the support level 1.2885 (red bold line). If this level is reached, the price may begin to move upward.
¡Los informes analíticos de InstaForex lo mantendrá bien informado de las tendencias del mercado! Al ser un cliente de InstaForex, se le proporciona una gran cantidad de servicios gratuitos para una operación eficiente.

