 Permanecer
Condiciones de negociación
Products
Herramientas


The pair traded in a side-channel on Thursday. At the beginning of the day, the price traded upward and retested the resistance level 1.2943 (black bold line), this was followed by a downward pullback which tested 1.2827 - a 50% pullback level. (red dotted line). According to the economic calendar, dollar news is expected at 12:30 UTC.
Trend analysis (Fig. 1).
The market may continue to move downward from the level of 1.2893 (closing of Thursday's daily candlestick) with the target of 1.2827 - a 50.0% pullback level (red dotted line). Upon reaching this level, the price may begin to move upwards with the target at the resistance level 1.2942 (black bold line). Upon testing the said level, the upward trend may continue with the next target at the upper fractal 1.2979 (red dashed line). Much will depend on the market reaction to the news that comes out at 12:30 UTC.
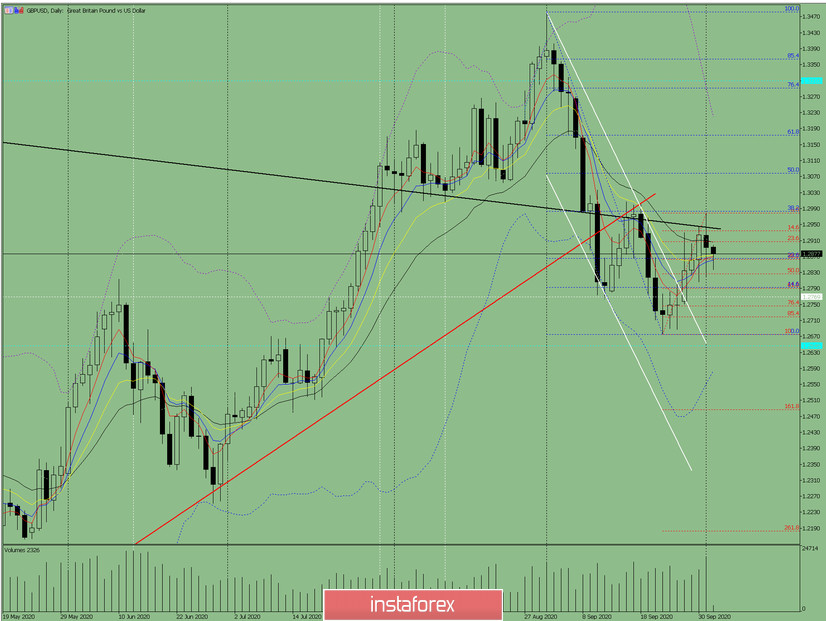
Figure: 1 (daily chart).
Comprehensive analysis:
- Indicator analysis - down;
- Fibonacci levels - down;
- Volumes - up;
- Candlestick analysis - down;
- Trend analysis - up;
- Bollinger lines - down;
- Weekly chart - up.
General conclusion:
Today, the price may move down from the level of 1.2893 (closing of Thursday's daily candlestick) with the target of 1.2827 - a 50.0% pullback level (red dotted line). Upon reaching this level, the price may begin to move upwards with the target at the resistance level 1.2942 (black bold line).
Another possible scenario: upon testing the level of 1.2827 (red dotted line), the price may continue to move down with the next target at the historical support level 1.2769 (white dotted line).
¡Los informes analíticos de InstaForex lo mantendrá bien informado de las tendencias del mercado! Al ser un cliente de InstaForex, se le proporciona una gran cantidad de servicios gratuitos para una operación eficiente.


