 Permanecer
Condiciones de negociación
Products
Herramientas


Trend analysis (Fig. 1). on
The market started from the level of 1.1709 (closing of yesterday's daily candle). It may continue to move down with the goal of 1.1665 with a pullback level of 76.4% (blue dotted line). In the case of testing this level, work down to the level of 1.1649 which is the support line (black bold line).
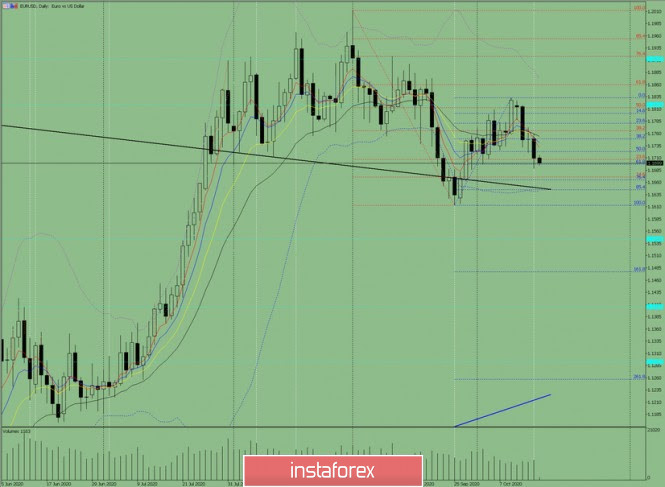
Figure 1 (daily chart).
Complex Analysis:
General conclusion:
The price from the level of 1.1709 (closing yesterday's daily candle) can continue to move down with the goal of 1.1665 with a pullback level of 76.4% (blue dotted line). In the case of testing this level, work down to the level of 1.1649 which is the support line (black bold line).
Alternative scenario: From the level of 1.1709 (the closing of yesterday's daily candle), it may continue to move down with the goal of 1.1689 which is the lower fractal (candle from 15.10.2020). After testing this level, work up with the goal of 1.1766 with a pullback level of 38.2% (red dotted line).
¡Los informes analíticos de InstaForex lo mantendrá bien informado de las tendencias del mercado! Al ser un cliente de InstaForex, se le proporciona una gran cantidad de servicios gratuitos para una operación eficiente.


