 Permanecer
Condiciones de negociación
Products
Herramientas


Trend analysis
The price from the level of 1.1716 (closing of the last weekly candle) may continue to pullback downward this week with the goal of 1.1669 - the pullback level of 74.6% (red dashed line). From this level, we can continue to decline with the goal of 1.1612 - the lower fractal (red dotted line). After testing this level, the price may begin to move upwards.
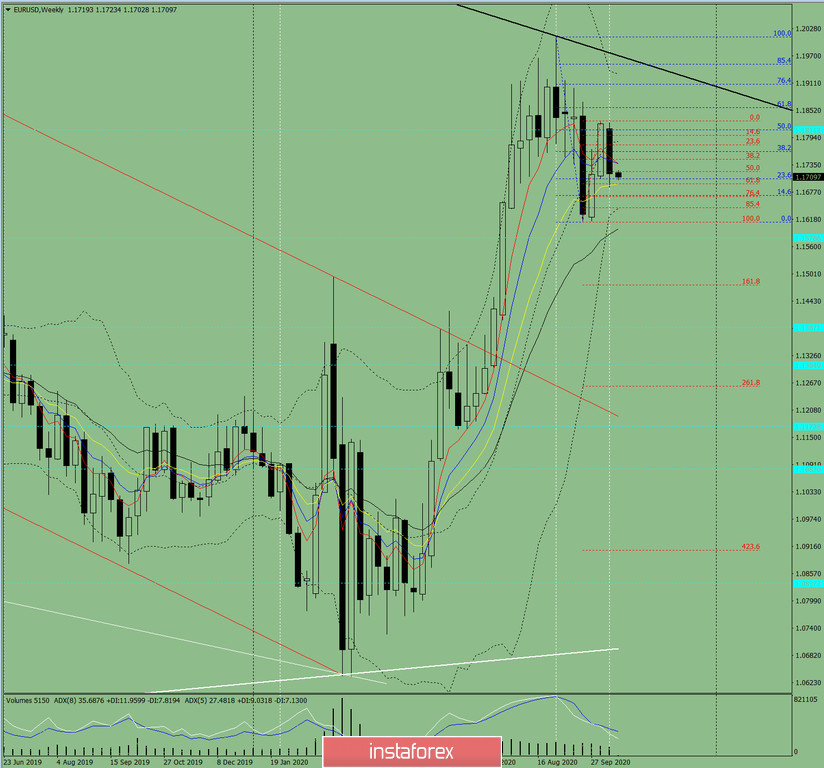
Figure: 1 (weekly chart).
Comprehensive analysis:
- indicator analysis - down;
- Fibonacci levels - down;
- volumes - down;
- candlestick analysis - down;
- trend analysis - down;
- Bollinger lines - up;
- monthly chart - up.
A downward movement can be concluded based on the comprehensive analysis.
The overall result of the calculation of the candlestick of the EUR/USD pair on the weekly chart: this week, the price is likely to have a downward trend without the upper shadow in the weekly black candlestick (Monday - down) and with the lower shadow (Friday - up).
The first lower target of 1.1669 is a pullback level of 74.6% (red dotted line). When testing this level, we can further decline towards the goal of 1.1612 - the lower fractal (red dotted line).
An unlikely scenario: a decline from the level of 1.1716 (closing of the last weekly candle) with the goal of 1.1669 - a pullback level of 74.6% (red dotted line) is unlikely.
¡Los informes analíticos de InstaForex lo mantendrá bien informado de las tendencias del mercado! Al ser un cliente de InstaForex, se le proporciona una gran cantidad de servicios gratuitos para una operación eficiente.

