 Permanecer
Condiciones de negociación
Products
Herramientas


Trend analysis (Figure 1)
Today, from the level of 1.1786 (closing of yesterday's daily candlestick), the market may continue to move down with the goal of 1.1756 - the support line (white bold line). If this line is tested, further upward work is possible with the goal of 1.1807, which is the 50% pullback level (blue dotted line). From this level, it is possible to work upward.
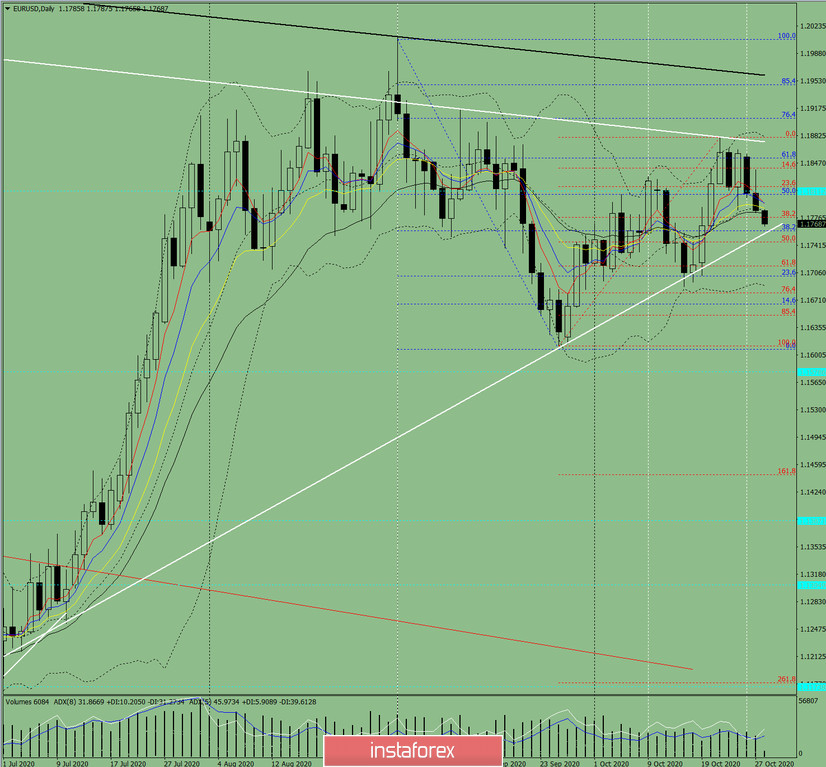
Figure 1 (Daily Chart)
Comprehensive analysis:
General conclusion:
Today, the price may continue to move down with the target of 1.1756 - the support line (white bold line). If this line is tested, further upward work is possible with the goal of 1.1807, which is the 50% pullback level (blue dotted line). From this level, it is possible to work upward.
Unlikely scenario: upon moving down and reaching the support line 1.1756 (white bold line), the price may start moving down to 1.1715 (red dotted line), which is the 61.8% pullback level.
¡Los informes analíticos de InstaForex lo mantendrá bien informado de las tendencias del mercado! Al ser un cliente de InstaForex, se le proporciona una gran cantidad de servicios gratuitos para una operación eficiente.

