 Permanecer
Condiciones de negociación
Products
Herramientas


Trend analysis
The price from the level of 1.3151 (closing of the last weekly candle) is expected to rise this week to the goal of 1.3289 - pullback level of 76.4% (blue dotted line). If this line is reached, the pair is likely to further grow towards the next goal of 1.3363 - the pullback level of 85.4% (blue dashed line). After reaching this level, a downward movement can be considered.
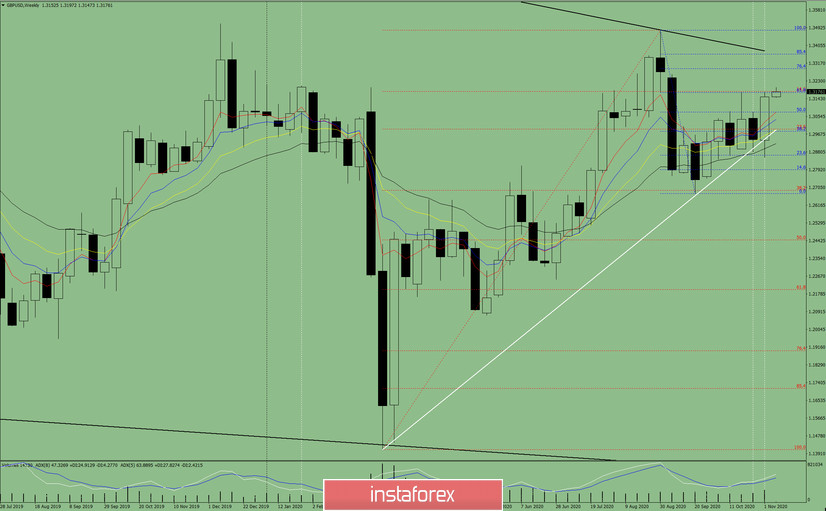
Figure 1 (weekly chart)
Comprehensive analysis:
- indicator analysis - up;
- Fibonacci levels - up;
- volumes - up;
- candlestick analysis - up;
- trend analysis - up;
- Bollinger lines - up;
- monthly chart - up.
A rise can be concluded based on comprehensive analysis.
The total result of calculating the candlestick of the GBP/USD pair on the weekly chart: the price is likely to have an upward trend this week with no first lower shadow of the weekly white candlestick (Monday - up) and no second upper shadow (Friday - up).
The first upside goal is 1.3289 - a pullback level of 76.4% (blue dotted line). If this line is reached, the pair is likely to further grow towards the next goal of 1.3363 - the pullback level of 85.4% (blue dashed line). After reaching this level, a downward movement can be considered.
An alternative scenario: the price from the level of 1.3151 (the close of the last weekly candle) will decline to be able to reach the pullback level of 23.6% - 1.2991 (red dashed line). If this line is reached, we can move further below in order to test the support line - 1.2888 (white thick line).
¡Los informes analíticos de InstaForex lo mantendrá bien informado de las tendencias del mercado! Al ser un cliente de InstaForex, se le proporciona una gran cantidad de servicios gratuitos para una operación eficiente.

