 Permanecer
Condiciones de negociación
Products
Herramientas


Yesterday, the pair went up and tested almost at the upper fractal 1.2010 (blue dotted line), then it went down quite strongly breaking through the lower pullback level of 38.2% at 1.1944 (red dotted line). Today, the price may continue to move up and according to the economic calendar news, it is expected at 8.55, 10.00, 17.00 UTC (Euro) and 15.00 UTC (dollar).
Trend Analysis (Fig. 1).
Today, the market will continue to move up from the level of 1.1926 (closing of yesterday's daily candle) with the target of 1.2010 at the upper fractal (blue dotted line), the daily candle from 09/01/2020. After testing this line, the price will continue to go up with the target of 1.1920 at the upper fractal (red dotted line).
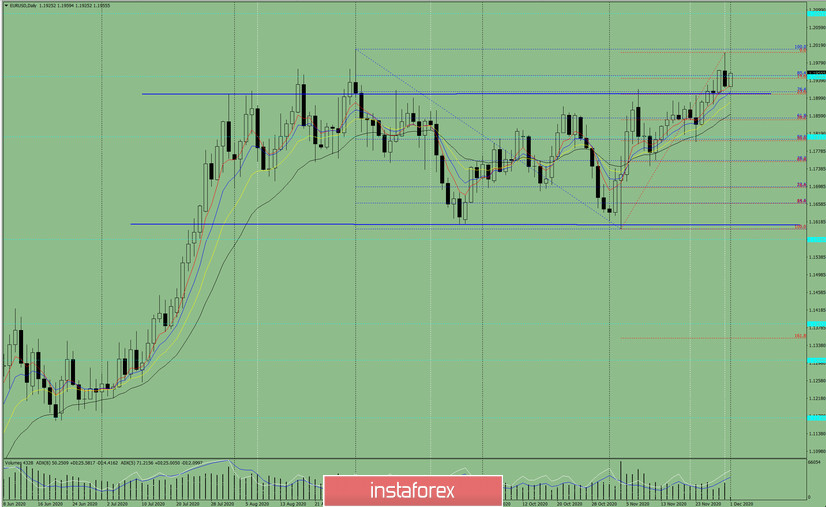
Figure 1 (daily chart).
Complex Analysis:
General Conclusion:
Today, the price will continue to move up from the level of 1.1839 (closing of yesterday's daily candle) with the target of the 1.1880 resistance line (white bold line). After testing this line, the price will continue to go up with the target of 1.1920 at the upper fractal (red dotted line).
Unlikely scenario: when going upwards, after reaching the retracement level of 76.4% at 1.1875 (blue dotted line) there will be a work going down with the target of 1.1798 at the retracement level of 38.2% (red dotted line).
¡Los informes analíticos de InstaForex lo mantendrá bien informado de las tendencias del mercado! Al ser un cliente de InstaForex, se le proporciona una gran cantidad de servicios gratuitos para una operación eficiente.

