 Permanecer
Condiciones de negociación
Products
Herramientas


Trend analysis
The price from the level of 1.3371 (closing of the November monthly candlestick) may likely rise this month towards the first target of 1.3481 – an upper fractal (blue dotted line), monthly candlestick from 09/01/20. In case of testing this level, it is possible to further move upwards to the next upper target of 1.3600 – the pullback level of 76.4% (red dotted line). Lastly, the final monthly target may be the historical resistance level of 1.3742 (blue dotted line).
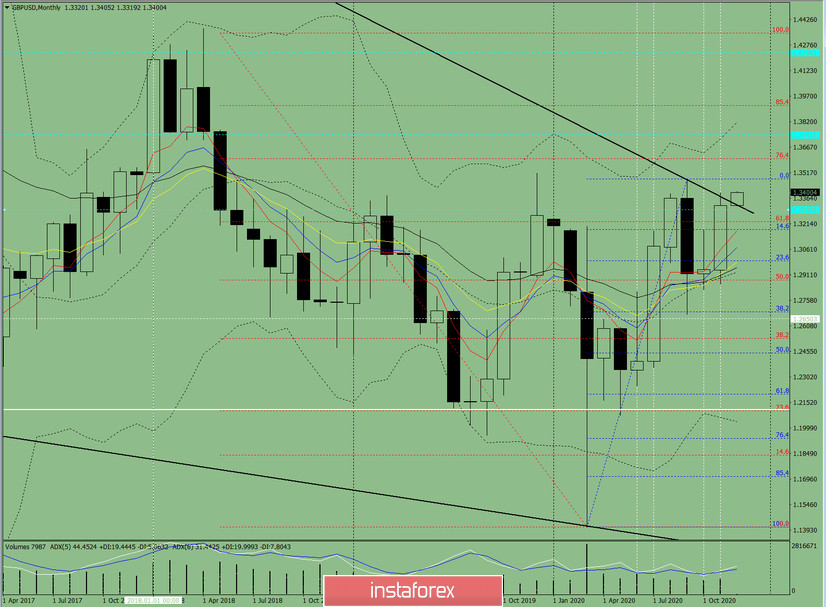
Figure 1 (monthly chart)
Indicator analysis:
- indicator analysis - up;
- Fibonacci levels - up;
- volumes - up;
- candlestick analysis - up;
- trend analysis - down;
- Bollinger lines - up;
A possible upward trend can be concluded based on a comprehensive analysis.
The overall result of the candlestick calculation on the monthly chart: the price will most likely have an upward trend with no first lower shadow (the first week of the month is white) at the monthly white candlestick and with no second upper shadow (the last week is white).
The most likely scenario: from the level of 1.3371 (closing of the November monthly candlestick), an upward movement is likely to the first target of 1.3481 – upper fractal (blue dotted line), monthly candlestick from 09/01/2020. After testing this level, it is possible to further increase towards the next upper target of 1.3600 - the pullback level of 76.4% (red dotted line). The final monthly target may be the historical resistance level of 1.3742 (blue dotted line).
An unlikely scenario: working downwards to the target of 1.3333 - the support line (black bold line) is unlikely, after the price rises from the level of 1.3371 (closing of the November monthly candlestick) to the target of 1.3481 – upper fractal (blue dotted line), the monthly candlestick from 09/01/2020.
¡Los informes analíticos de InstaForex lo mantendrá bien informado de las tendencias del mercado! Al ser un cliente de InstaForex, se le proporciona una gran cantidad de servicios gratuitos para una operación eficiente.


