empty
 
 
Está a punto de salir de
www.instaforex.eu >
un sitio web operado por
INSTANT TRADING EU LTD
Abrir cuenta

23.12.202009:25 Forex Analysis & Reviews: Indicator analysis. Daily review for the GBP/USD currency pair on 23/12/2020

Esta información se proporciona a clientes minoristas y profesionales como parte de comunicación de marketing. No contiene y no debe interpretarse como asesoramiento o recomendación de inversión o una oferta o solicitud para participar en cualquier transacción o estrategia en instrumentos financieros. El desempeño pasado no garantiza o predice el desempeño futuro. Instant Trading EU Ltd. no asume ninguna representación ni responsabilidad sobre la precisión o integridad de la información proporcionada, o cualquier pérdida que surja de cualquier inversión basada en el análisis, pronóstico u otra información proporcionada por un empleado de la Compañía o de otra manera. El descargo de responsabilidad completo está disponible aquí.

Trend analysis (figure 1).

Today, from the level of 1.3357 (the closing of yesterday's daily candle), the market will try to continue moving up to reach the historical resistance level at 1.3481 (blue dotted line). If this level is tested, continue to work up with the target of 1.3563 which is the resistance line (red bold line).

Exchange Rates 23.12.2020 analysis

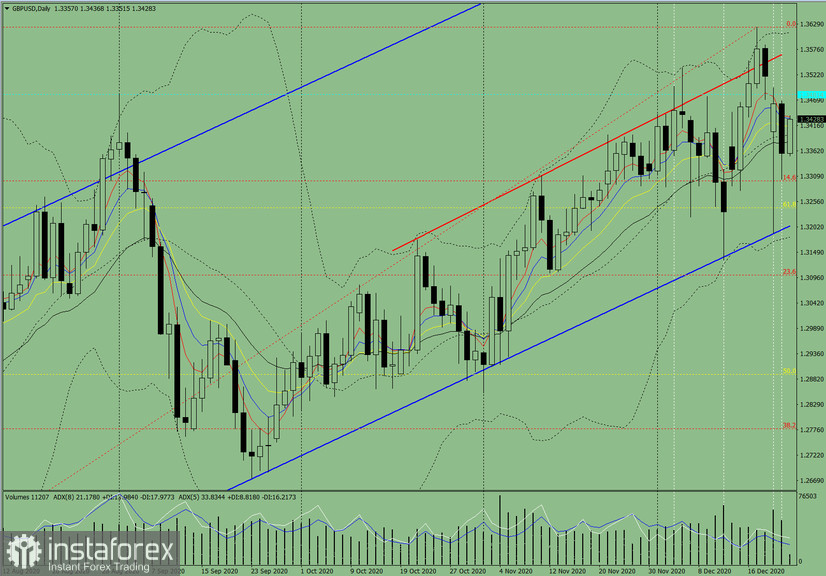
Figure 1 (daily chart).

Comprehensive Analysis:

  • Indicator Analysis – up
  • Fibonacci Levels – up
  • Volumes – up
  • Candle Analysis – up
  • Trend Analysis – up
  • Bollinger Bands – up
  • Weekly Chart – up

General Conclusion:

Today, from the level of 1.3357 (the closing of yesterday's daily candle), the market will try to continue moving up with the target of the historical resistance level at 1.3481 (blue dotted line). If this level is tested, continue to work up with the target of 1.3563 which is the resistance line (red bold line).

Alternative Scenario: From the level of 1.3455 (the closing of yesterday's daily candle), the market will try to continue its upward movement in order to reach the historical resistance level at 1.3481 (blue dotted line). In the case of testing this level, work downwards with the target of 1.3382– 21 average EMA (black thin line).

Desarrollado por un Stefan Doll
experto de análisis de InstaForex
© 2007-2024

Abra una cuenta de operaciones

¡Los informes analíticos de InstaForex lo mantendrá bien informado de las tendencias del mercado! Al ser un cliente de InstaForex, se le proporciona una gran cantidad de servicios gratuitos para una operación eficiente.


Usted está ahora saliendo de www.instaforex.eu, un sitio web operado por INSTANT TRADING EU LTD
¿No puede hablar ahora mismo?
Ingrese su pregunta en el chat.

Turn "Do Not Track" off