empty
 
 
Está a punto de salir de
www.instaforex.eu >
un sitio web operado por
INSTANT TRADING EU LTD
Abrir cuenta

31.12.202010:44 Forex Analysis & Reviews: Indicator analysis. Daily review for the GBP/USD pair on 12/31/20

Esta información se proporciona a clientes minoristas y profesionales como parte de comunicación de marketing. No contiene y no debe interpretarse como asesoramiento o recomendación de inversión o una oferta o solicitud para participar en cualquier transacción o estrategia en instrumentos financieros. El desempeño pasado no garantiza o predice el desempeño futuro. Instant Trading EU Ltd. no asume ninguna representación ni responsabilidad sobre la precisión o integridad de la información proporcionada, o cualquier pérdida que surja de cualquier inversión basada en el análisis, pronóstico u otra información proporcionada por un empleado de la Compañía o de otra manera. El descargo de responsabilidad completo está disponible aquí.

Trend analysis (Fig. 1)

Today, the price from the level of 1.3620 (closing of yesterday's daily candle) will try to move upwards to the target of 1.3677 – the pullback level of 76.4% (yellow dotted line). After testing this line, the upward movement may continue to the next target of 1.3943 – the pullback level of 85.4% (yellow dotted line).

Exchange Rates 31.12.2020 analysis

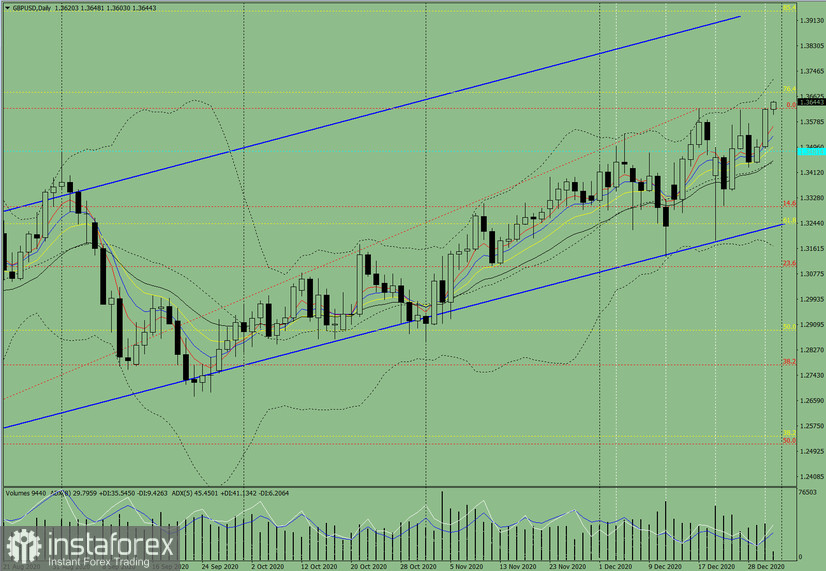
Figure 1 (daily chart).

Comprehensive analysis:

  • Indicator analysis - up
  • Fibonacci levels - up
  • Volumes - up
  • Candlestick analysis - up
  • Trend analysis - up
  • Bollinger lines - up
  • Weekly chart - up

Overall conclusion:

Today, the price from the level of 1.3620 (closing of yesterday's daily candle) will most likely continue rising towards the target of 1.3677 – the pullback level of 76.4% (yellow dotted line). Upon testing this line, the upward movement may continue to the next target of 1.3943 – the pullback level of 85.4% (yellow dotted line).

An alternative scenario: the price from the level of 1.3620 (closing of yesterday's daily candle) may continue to move upwards to the target of 1.3677 – the pullback level of 76.4% (yellow dotted line). After testing this line, a downward pullback is possible, with the target of 1.3481 – the historical support level (blue dashed line).

Desarrollado por un Stefan Doll
experto de análisis de InstaForex
© 2007-2024

Abra una cuenta de operaciones

¡Los informes analíticos de InstaForex lo mantendrá bien informado de las tendencias del mercado! Al ser un cliente de InstaForex, se le proporciona una gran cantidad de servicios gratuitos para una operación eficiente.


Usted está ahora saliendo de www.instaforex.eu, un sitio web operado por INSTANT TRADING EU LTD
¿No puede hablar ahora mismo?
Ingrese su pregunta en el chat.

Turn "Do Not Track" off