 Permanecer
Condiciones de negociación
Products
Herramientas


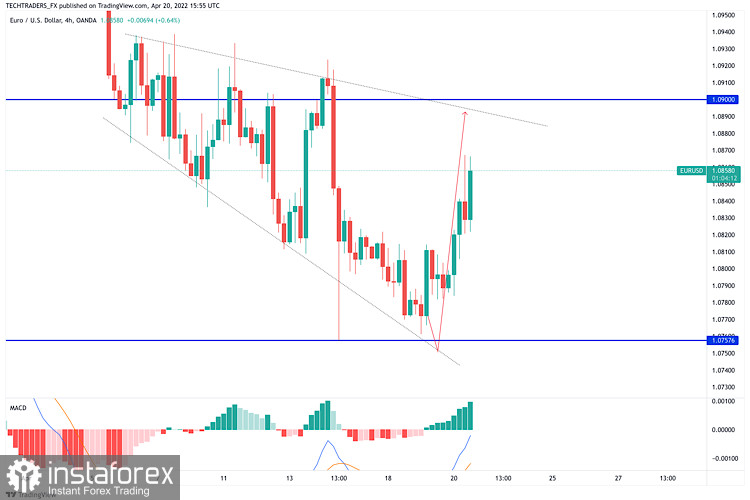
EUR/USD has regained its traction and advanced above 1.0850 after retreating toward 1.0820 in the early American session. With the benchmark 10-year US T-bond yield falling more than 2% on the day, the greenback continues to weaken against its rivals and helps the pair edge higher.
The EUR/USD pair is up for a second consecutive day but far from turning bullish. It has briefly surpassed the 23.6% retracement of its latest daily decline measured between 1.1184 and 1.0756 at 1.0856, an immediate resistance level. The next Fibonacci retracement comes at 1.0920, and recovery beyond it could put the pair on a near-term bullish path.
Technical readings in the daily chart suggest that the risk is skewed to the downside. The 20 SMA heads are firmly lower, converging with the 38.2% retracement of the aforementioned decline, as technical indicators recover from near oversold readings, still well below their midlines.
The 4-hour chart shows favors another leg north, particularly if the pair moves above the aforementioned Fibonacci resistance. The pair is developing above a now flat 20 SMA, while the longer ones maintain their bearish slopes well above the current level. Technical indicators, in the meantime, are neutral-to-bullish within positive levels, reflecting absent selling interest at the time being.
Support levels: 1.0795 1.0760 1.0720
Resistance levels:1.0865 1.0920 1.0970
¡Los informes analíticos de InstaForex lo mantendrá bien informado de las tendencias del mercado! Al ser un cliente de InstaForex, se le proporciona una gran cantidad de servicios gratuitos para una operación eficiente.


