 Permanecer
Condiciones de negociación
Products
Herramientas


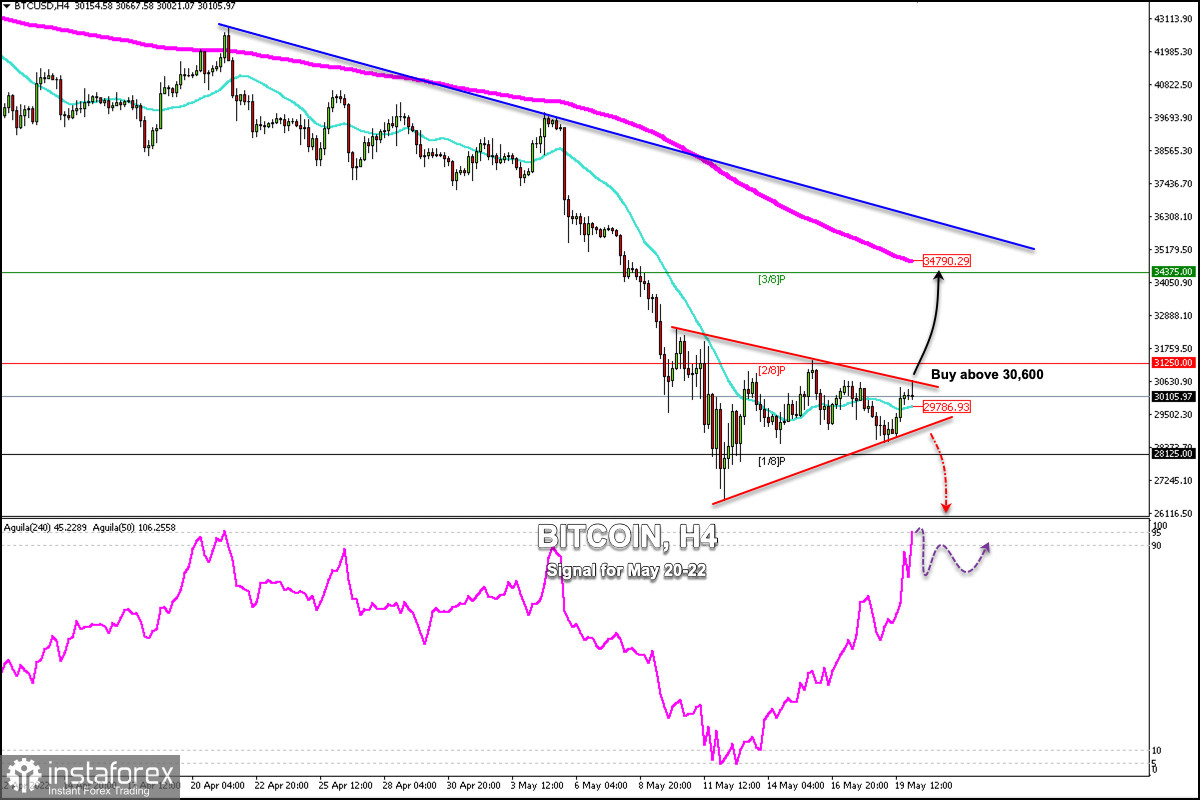
Bitcoin (BTC/USD) is trading above the 21 SMA located at $29,786 and inside the symmetrical triangle formed on May 8. Right now, Bitcoin is trading around the psychological level of $30,000.
A sharp break above this symmetrical triangle around $30,600 could mean the advance of Bitcoin and it could reach 3/8 Murray around $34,375 and even towards the 200 EMA at $34,790.
Conversely, if BTC breaks below the symmetrical triangle and consolidates below $29,000, we could expect further bearish pressure and the price may reach 1/8 Murray at $28,127 and even drop to 0/8 Murray at $25,000.
Since the beginning of the week, the equity market has been under strong selling pressure. As BTC is correlated with the Nasdaq-100, the token kept its upward movement limited.
In the medium term, Bitcoin is trading in a strong downtrend. In the short term, Bitcoin is trading in a range between $31,250 and $28,500. A pullback towards $34,790 or the top of the downtrend channel around $35,200 will be seen as an opportunity to sell with medium-term targets at $25,000.
The eagle indicator on the 4-hour chart has reached the extremely overbought zone. This could be a negative sign for Bitcoin. In case there is a break above $30,600, the bearish pressure is likely to intensify.
Our trading plan for the next few hours is to wait for a sharp break above $30,600 to buy with targets at $32,800 and $34,790.
¡Los informes analíticos de InstaForex lo mantendrá bien informado de las tendencias del mercado! Al ser un cliente de InstaForex, se le proporciona una gran cantidad de servicios gratuitos para una operación eficiente.


