 Permanecer
Condiciones de negociación
Products
Herramientas

INTC ended last week on a multi year lower low. In previous posts we talked about price challenging major horizontal support that was respected for the last 5 years. Last week price traded below $42,50 for the first time since 2017.
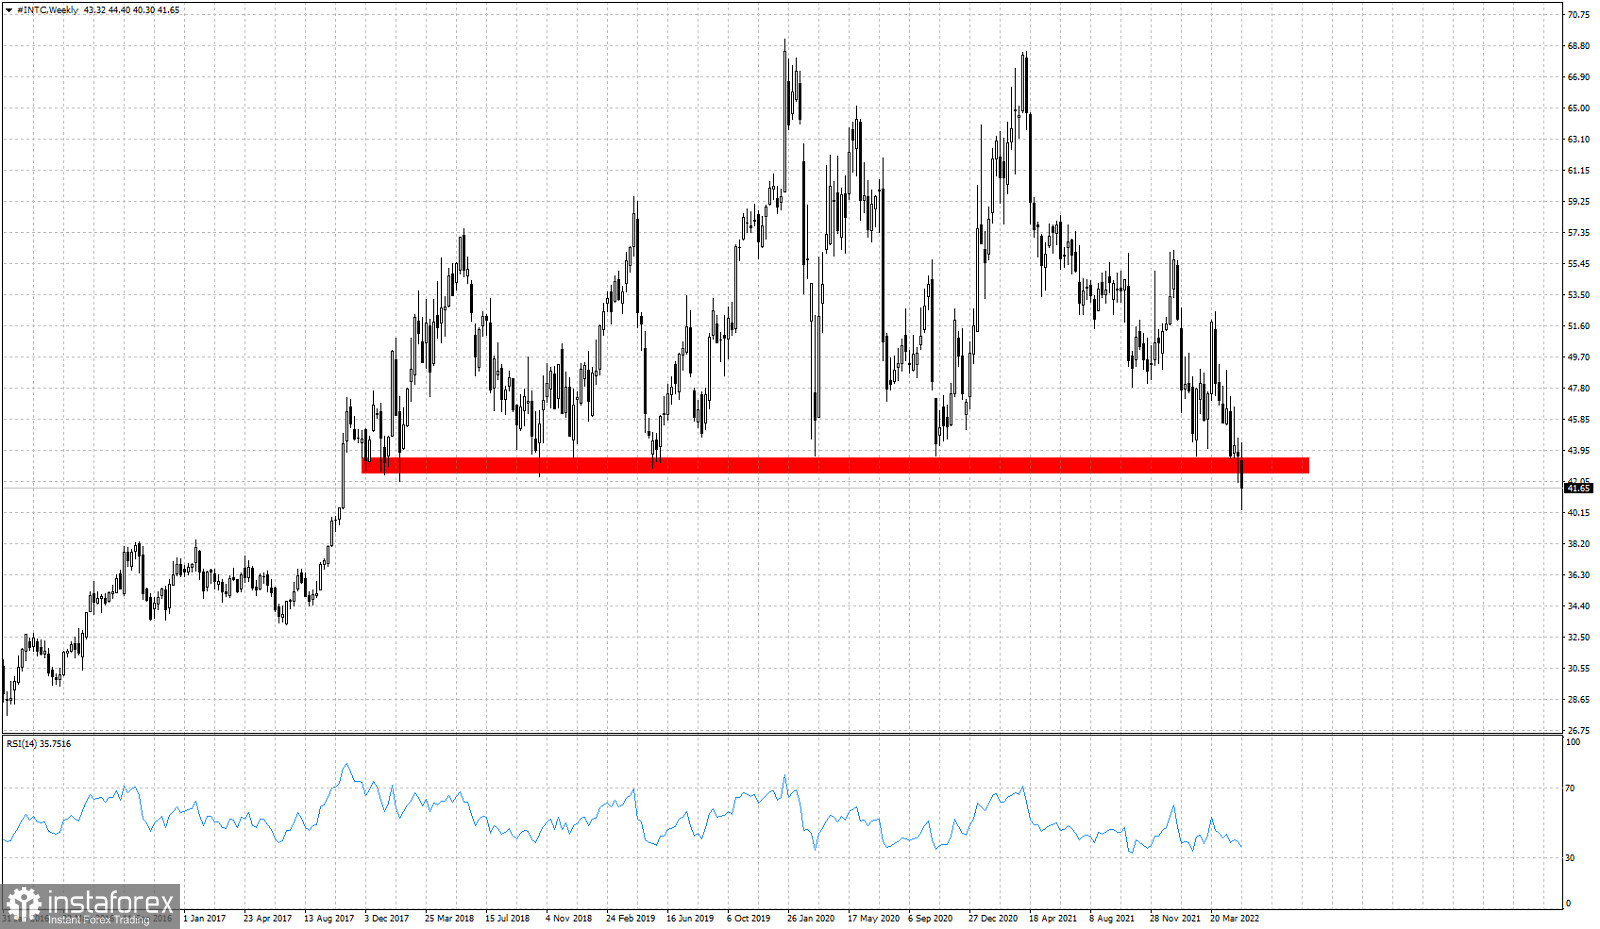
Is this a fake break down or a new bearish signal? The RSI does not confirm the new weekly low as it is making a higher low. This bullish divergence is something we should not ignore, however such a bullish divergence is not a reversal signal, but only a warning to bears. Nevertheless price broke below the support and closed last week below $42. A back test of the previous support and now resistance is expected. Technically trend remains bearish as price continues making lower lows and lower highs. If bulls manage to recapture $42,50 soon, we could be talking about a fake break down.
¡Los informes analíticos de InstaForex lo mantendrá bien informado de las tendencias del mercado! Al ser un cliente de InstaForex, se le proporciona una gran cantidad de servicios gratuitos para una operación eficiente.


