 Permanecer
Condiciones de negociación
Products
Herramientas


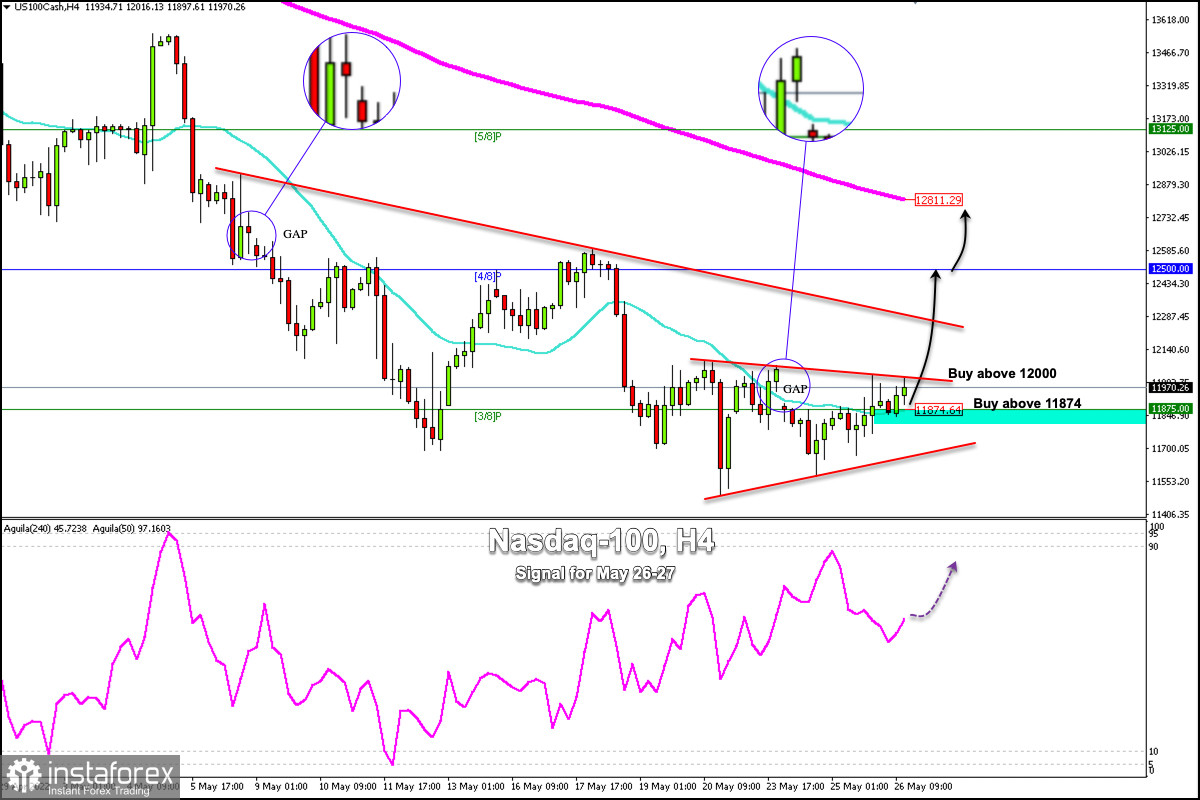
The Nasdaq-100 Tech Index (#NDX) is trading at 11,970 in the American session above the 21 SMA and above 3/8 Murray with a slightly bullish bias.
The NDX has strong resistance at 12,000, which coincides with the top of the symmetrical triangle.
A sharp break above the symmetrical triangle and consolidation above 12,000 could mean the advance of the Nasdaq-100 and it could reach the top of the downtrend channel around 12,300 formed on May 5.
The optimism in the equity market is due to the last meeting of the FED.
The minutes of the FOMC meeting on May 3-4 showed that policymakers unanimously felt that the US economy was very strong as they struggled to control inflation without triggering a recession. In addition, they said a 50-basis point rate hike would likely be appropriate in June and July.
This dovish tone from the FED is boosting the price of the top 100 tech stocks reflected in the Nasdaq-100 index, which since the early Asian session is showing strong upward momentum and is likely to continue for the rest of the day.
The main trend is down according to the daily chart. A trade through 12,811 where the 200 EMA is located will turn the main trend to the upside. Conversely, if the Nasdaq-100 fails to break the 200 EMA around 12,700 - 12,811, it will signal a resumption of the main downtrend.
According to the 4-hour chart, we can see that the Nasdaq-100 left a GAP on May 20 at 12,053 and the other GAP on May 5 at 12,666. Therefore, it is likely that if it continues with its uptrend, it may cover both gaps in the coming days.
Our trading plan for the next few hours is to buy above the 21 SMA at 11,874 or wait for a sharp break above 12,000 to buy, with targets at 12,300 and 12,500 (4/8 Murray).
¡Los informes analíticos de InstaForex lo mantendrá bien informado de las tendencias del mercado! Al ser un cliente de InstaForex, se le proporciona una gran cantidad de servicios gratuitos para una operación eficiente.


