 Permanecer
Condiciones de negociación
Products
Herramientas


Trend analysis
The upward movement can be expected this month with the first target of 1.1675 – the pullback level of 14.6% (blue dotted line). Once this line is broken upwards, the next upward target will be set at 1.1747 – the pullback level of 23.6% (blue dotted line). After reaching it, further growth is possible to the target of 1.1852 – the pullback level of 38.2% (blue dotted line).
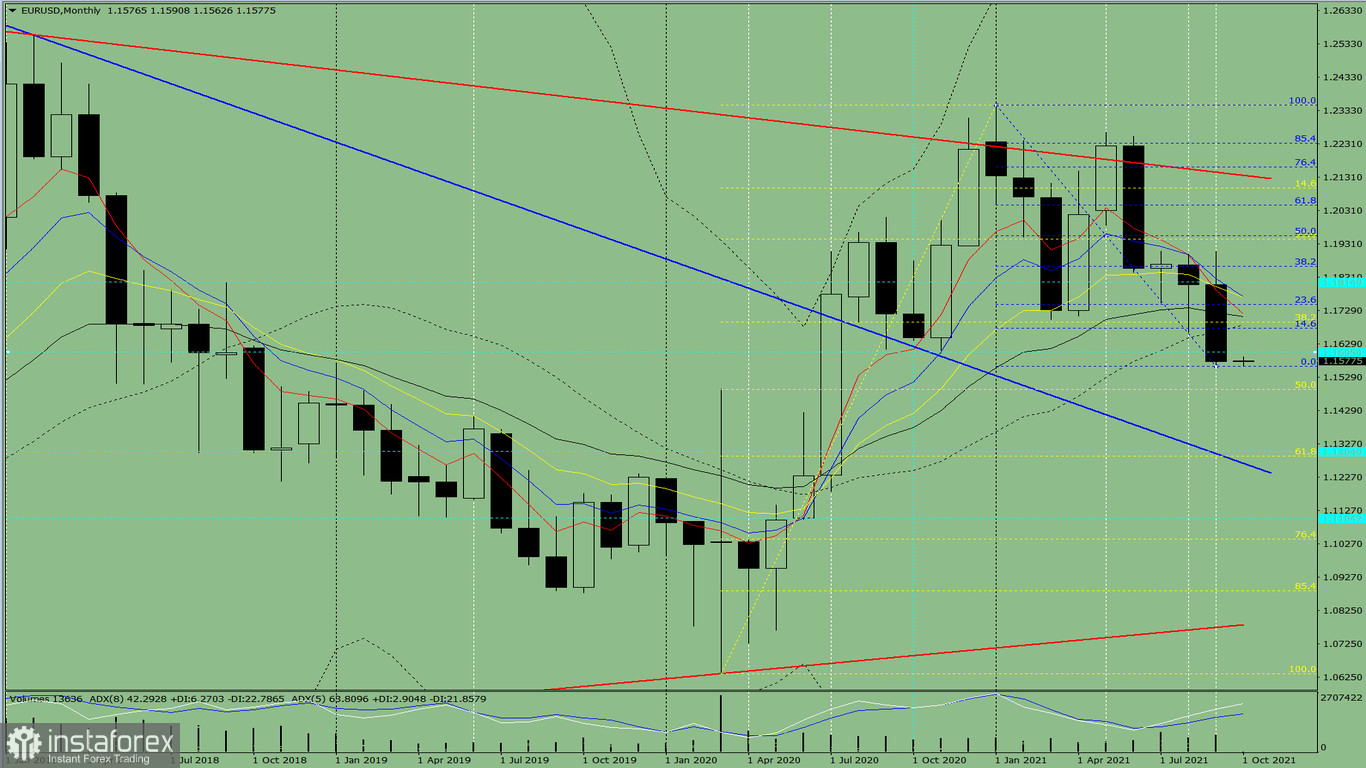
Figure 1 (monthly chart)
Indicator analysis:
An upward movement can be concluded based on a comprehensive analysis.
The overall result of the candlestick calculation based on the monthly chart: the price will most likely move in an upward trend, without the first lower shadow (the first week of the month is the upper one) and with the second upper shadow (the last week is black) in the monthly white candlestick.
General scenario: the price from the level of 1.1576 (closing of the September monthly candlestick) is expected to rise to the target of 1.1675 – the pullback level of 14.6% (blue dotted line). If it is broken upwards, the next upward target of 1.1747 – the pullback level of 23.6% (blue dotted line) will be considered. After reaching this level, the upward movement may resume to the target of 1.1852 – the pullback level of 38.2% (blue dotted line).
Alternatively, the price from the level of 1.1576 (closing of the September monthly candlestick) may decline to the target of 1.1491 – the pullback level of 50% (yellow dotted line). After testing it, it may further decline to the target of 1.1290 – the pullback level of 61.8% (yellow dotted line), and only then it can rise again.
¡Los informes analíticos de InstaForex lo mantendrá bien informado de las tendencias del mercado! Al ser un cliente de InstaForex, se le proporciona una gran cantidad de servicios gratuitos para una operación eficiente.


