 Permanecer
Condiciones de negociación
Products
Herramientas


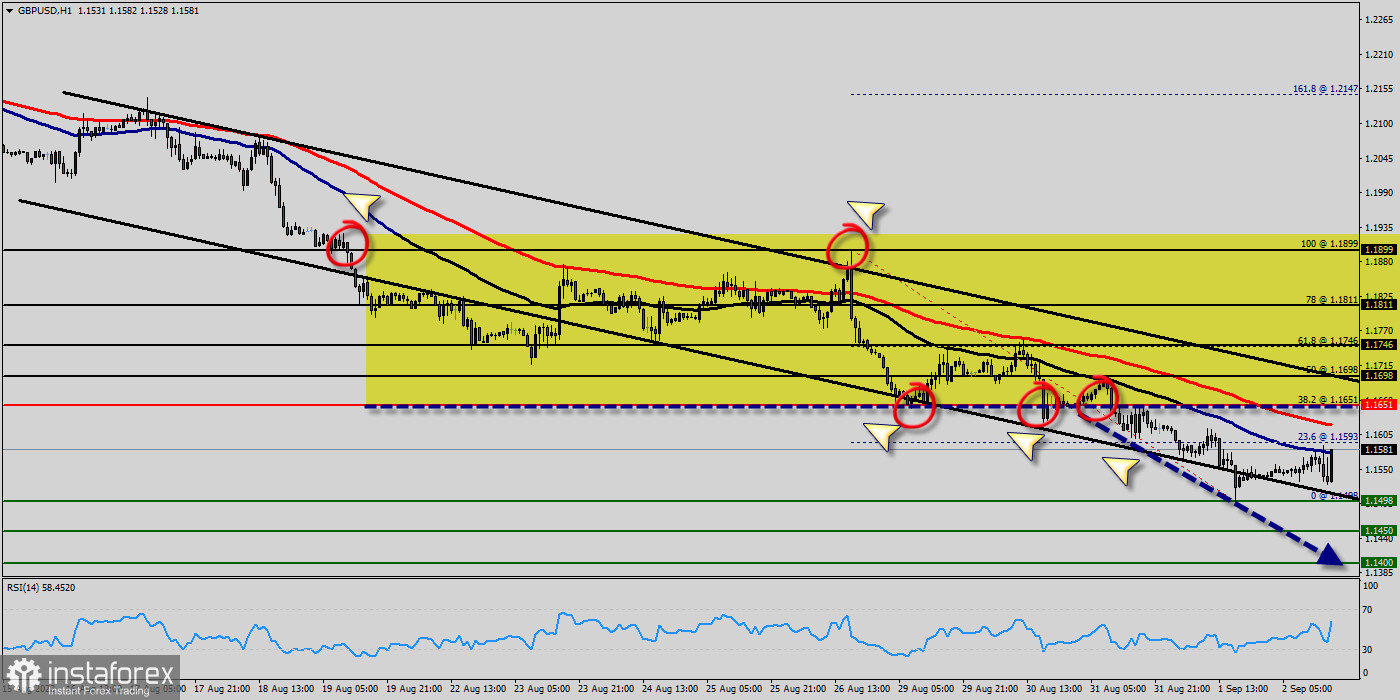
The GBP/USD pair decreased within an down channel. Closing below the pivot point (1.1651) could assure that the GBP/USD pair will move lower towards cooling new lows. the bears must break through 1.1581 n order to resume the down trend.
We expect to see a strong reaction off this level to push price down towards 1.1498 before 1.1451 support (Fibonacci retracement, horizontal swing low support). RSI (14) is seeing major resistance below 50% where a corresponding reaction could occur. This resistance has been rejected several times confirming the downtrend. Additionally, the RSI starts signaling a downward trend.
The GBP/USD pair dropped from the level of 1.1651 to the bottom around 1.1498. But the pair has rebounded from the bottom of 1.1498 to close at 1.1580.
The price of 1.1651 demand zone remains the next significant level of support for the GBP/USD pair. Since last week, given the market's bearish momentum and sentiment, another bearish swing towards the 1.1498 support level looks imminent.
Today, the first support level is seen at 1.1498, and the price is moving in a bearish channel now. Furthermore, the price has been set below the strong resistance at the level of 1.1651, which coincides with the 38.2% Fibonacci retracement level.
As a result, if the GBP/USD pair 1.1580 is able to break out the first support at 1.1498, the market will decline further to 1.1450 in order to test the daily support 2.
In the H1 time frame, the pair will probably go down because the downtrend is still strong. Consequently, the market is likely to show signs of a bearish trend.
Since there is nothing new in this market, it is not bullish yet. So, it will be good to sell below the level of 1.1651 with the first target at 1.1498 and further to 1.1450.
Forecast (GBP/USD) :
The volatility is very high for that the GBP/USD is still moving between 1.1651 and 1.1450 in coming days. Consequently, the market is likely to show signs of a bearish trend again. Hence, it will be good to sell below the level of 1.1651 and 1.1580 with the first target at 1.1498 and further to 1.1450 in order to test the weekly support2. However, if the GBP/USD is able to break out the daily resistance at 1.1651, the market will rise further to 1.1746 to approach resistance 2 today.
¡Los informes analíticos de InstaForex lo mantendrá bien informado de las tendencias del mercado! Al ser un cliente de InstaForex, se le proporciona una gran cantidad de servicios gratuitos para una operación eficiente.


