 Permanecer
Condiciones de negociación
Products
Herramientas


Here are the details of the economic calendar for October 13:
Britain published its industrial production data yesterday, where the growth rate slowed down from 3.8% to 3.7%. In monthly terms, the indicator rose by 0.8%.
The UK statistics turned out to be good, but the market traditionally ignored them.
Yesterday's main event is the publication of US inflation data. Consumer prices in September unexpectedly accelerated to 5.4%, against experts' expected growth of 5.3%.
The market reacted to the news speculatively, which resulted in the strengthening of the US dollar at first, and then a rapid weakening.
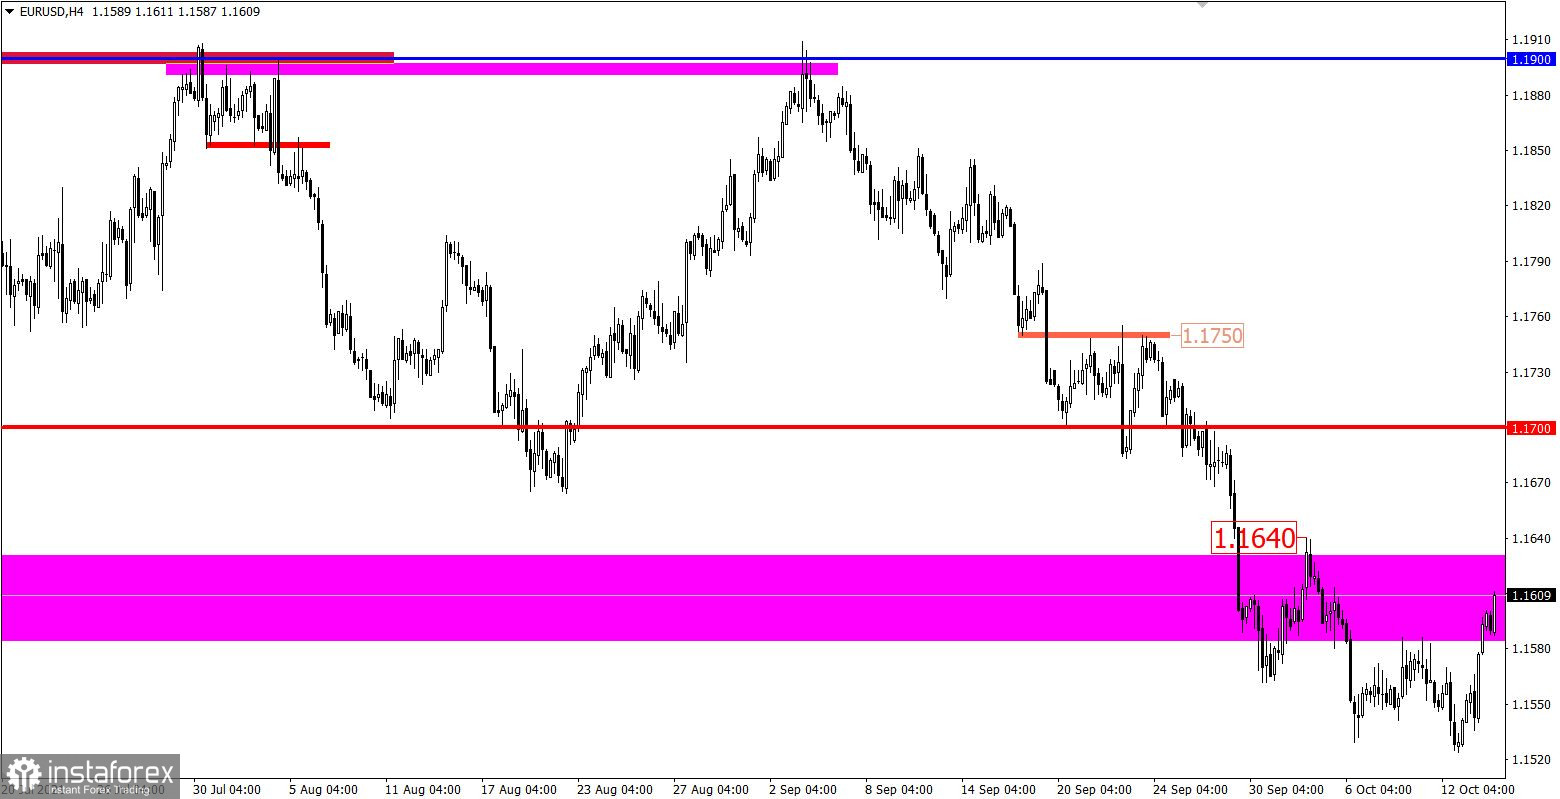
Analysis of trading charts from October 13:
The EUR/USD pair rebounded from the support area of 1.1529 again, which led to a local rise with a scale of more than 70 points. It is too early to talk about a major correction, as the euro is still oversold.
It can also be recalled that the euro has been losing more than 3% since the beginning of autumn, and it has been losing 5.6% since the beginning of June.
The GBP/USD pair completed the previous day within the sideways channel of 1.3540/1.3670 despite the upward interest. This leads to abundant attention from speculators.

October 14 economic calendar:
Today, the publication of data on US producer prices is expected, the growth rate of which may accelerate by 8.3% to 8.7%. The factor is positive, but the change is happening very quickly. There is a risk of similar price behavior as with inflation data, where the US dollar strengthened at the beginning, and then to sell-off.
Together with the indicators on producer prices, weekly data on applications for unemployment benefits in the United States will also be released, where a further recovery of the labor market is predicted.
Details of statistics:
The volume of initial applications for benefits may decline from 326 thousand to 319 thousand.
The volume of repeated applications for benefits may decline from 2 741 thousand to 2 675 thousand.
Based on the above economic calendar, the US statistics are not bad. Therefore, we closely monitor the behavior of speculators during the publication of data. It is possible to expect the local strengthening of the US dollar.
Trading plan for EUR/USD on October 14:
The quote is currently trying to hold above the level of 1.1600, which is a positive signal for the possible formation of a correction. The greatest interest in euro positions will arise when the price holds above the local high (1.1640) of October 4. In this case, traders will confirm the correction signal and receive a possible growth towards the level of 1.1700.
Trading plan for GBP/USD on October 14:
Since the European session opened, there has been a breakdown of the upper border of the 1.3540/1.3670 side channel. This led to a wave of speculation and, as a result, an impulse move. The area of the local high (1.3720/1.3750) from September 23 may well become a resistance level toward buyers.

What is reflected in the trading charts?
A candlestick chart view is graphical rectangles of white and black light, with sticks on top and bottom. When analyzing each candle in detail, you will see its characteristics of a relative period: the opening price, closing price, and maximum and minimum prices.
Horizontal levels are price coordinates, relative to which a stop or a price reversal may occur. These levels are called support and resistance in the market.
Circles and rectangles are highlighted examples where the price of the story unfolded. This color selection indicates horizontal lines that may put pressure on the quote in the future.
The up/down arrows are the reference points of the possible price direction in the future.
¡Los informes analíticos de InstaForex lo mantendrá bien informado de las tendencias del mercado! Al ser un cliente de InstaForex, se le proporciona una gran cantidad de servicios gratuitos para una operación eficiente.


