 Permanecer
Condiciones de negociación
Products
Herramientas


In today's article on the dollar/yen pair, we will look at the technical picture at several time intervals, and start with the weekly one.
Weekly
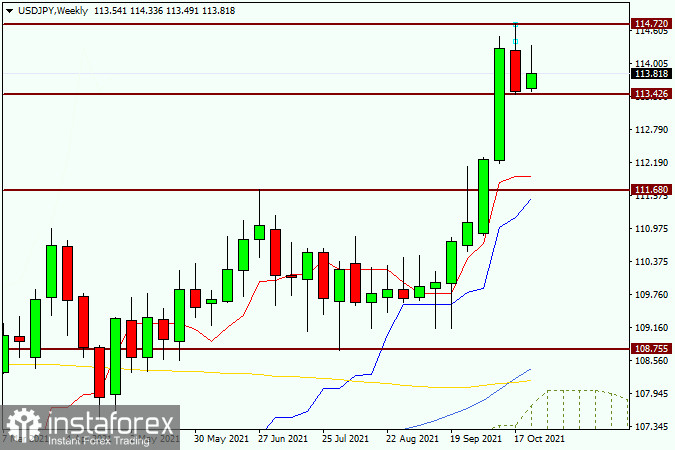
After a fairly long trade in the range of 111.68-108.75, the bulls on the instrument ran out of patience, and they made considerable efforts to exit this corridor upwards. At the same time, the last weekly candle was formed in the form of a reversal model of the "Harami" candle analysis. As you can see, at this week's auction, the bulls tried to continue the rate rise. However, after reaching the level of 114.33, the bullish candle began to deflate, and it already has a fairly long upper shadow. What's next? The question is interesting. Personally, given the weekly harami candle and the strength of resistance on the approach to 115.00, I expect a pullback to the broken resistance in the area of 112.00-111.70, where the pair can find support and resume growth. However, according to the weekly timeframe, it is very difficult (if at all possible) to find the exact points to enter the market.
Daily
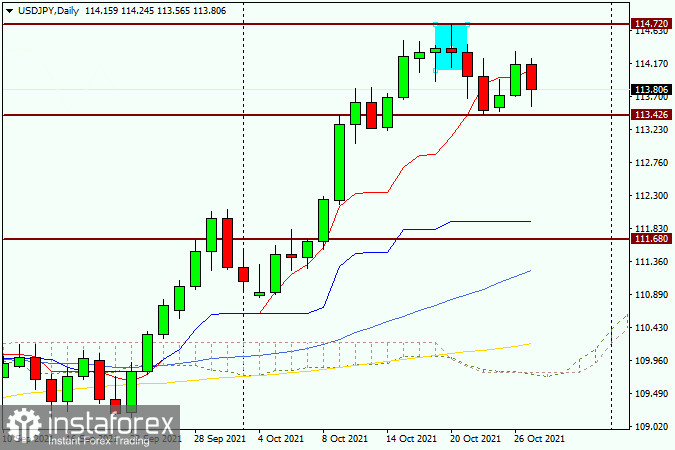
But on the daily chart of the pair on October 20, a reversal model of candle analysis "Rickshaw", or "Long-legged Doji" appeared. They are sufficiently similar, so the point is in their reversal character. The pair began to implement a downward scenario, while not forgetting to give kickbacks, after which you can plan sales. All this is very generous and technical. The pair is circling the Tenkan line of the Ichimoku indicator, and it is under selling pressure. I think the main question is whether the support near the very strong technical level of 113.40 will be able to contain the pressure of sellers and turn the course in the north direction. In case of a breakdown of this support level, we sell on a rollback to it. If a candle or a combination of reversal candlesticks of candle analysis appears above this mark, a signal will appear to open long positions. Personally, in my opinion, the growth of the pair can probably be considered completed, and after short-term pullbacks, open short positions. I recommend looking for the nearest sales on the approach to a very serious and important mark of 114.00.
¡Los informes analíticos de InstaForex lo mantendrá bien informado de las tendencias del mercado! Al ser un cliente de InstaForex, se le proporciona una gran cantidad de servicios gratuitos para una operación eficiente.


