 Permanecer
Condiciones de negociación
Products
Herramientas


The GBP/USD pair reached the resistance level of 1.3600 on the way of the corrective movement, where there was a natural reduction in the volume of short positions. This led to a pullback, and then to price stagnation
The price movement in a narrow amplitude signals the accumulation of trading forces, which is highly likely to lead to a new round of acceleration. How to trade in this case will be described below.

November 10 economic calendar:
The US inflation data will be released at 13:30 Universal time today. Consumer prices have always been considered one of the two fundamental factors in determining the parameters of the monetary policy of any central bank. In normal economic conditions, a moderate increase in inflation is perceived as a positive factor. However, when the global economy is trying to recover from the effects of the coronavirus crisis, excessive growth in consumer prices threatens not only the recovery of the global economy but also threatens a new wave of global economic downturn.
Thus, the current inflation growth is considered a negative manifestation.
A further increase in consumer prices is expected from 5.4% to 5.8%.
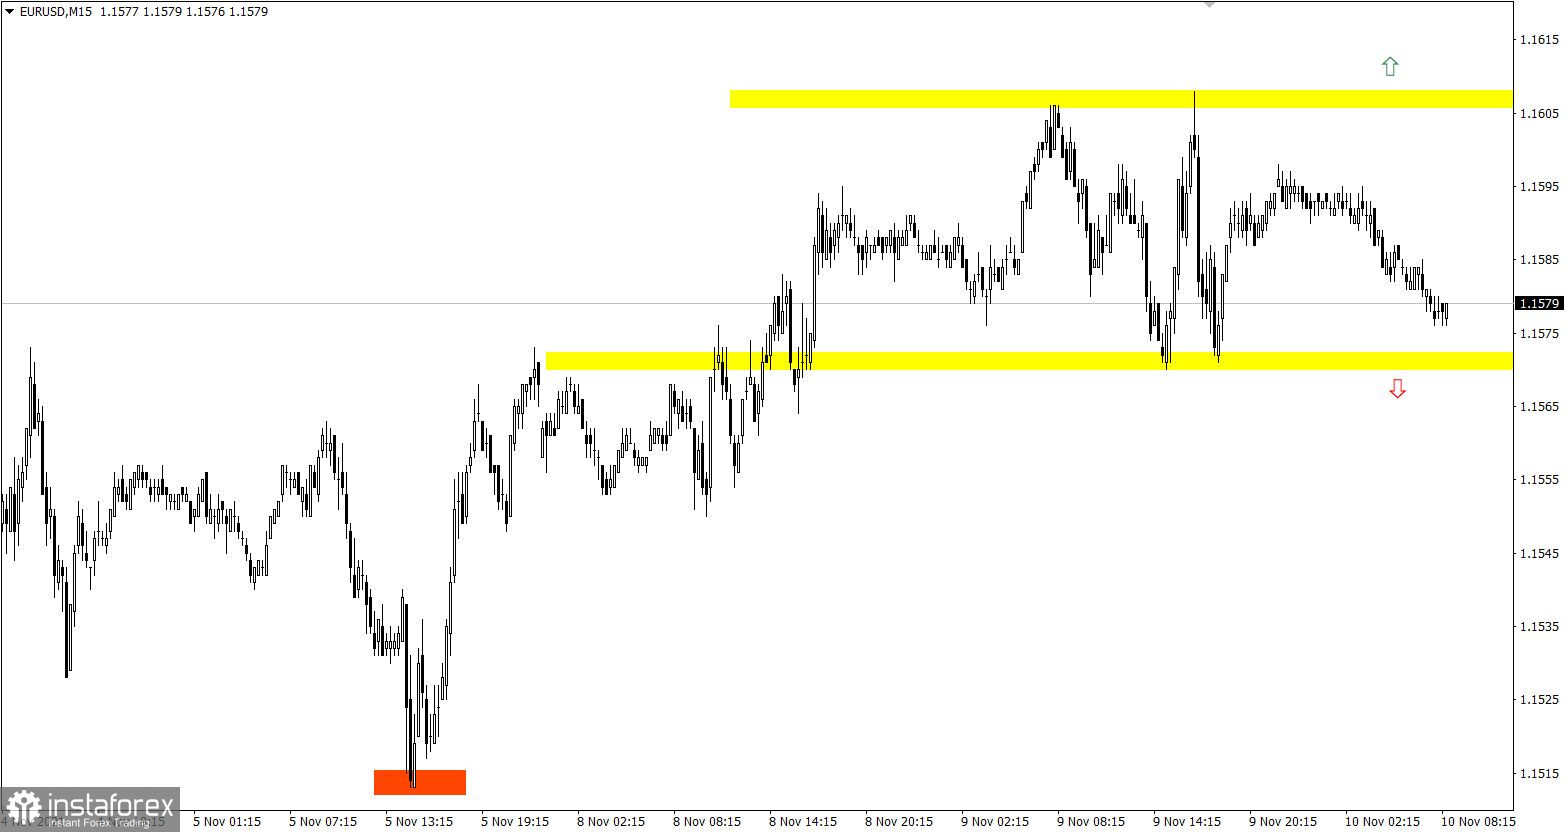
Trading plan for EUR/USD on November 10:
It can be assumed that the price movement in the range of 1.1570/1.1605 will remain on the market for some time. This will lead to abundant attention from speculators and a new round of acceleration in the market.
The most suitable trading tactic is considered to be the method of breaking one or another border of the established range.
Trading recommendations:
Buy positions should be considered after holding the price above the level of 1.1615.
Sell positions should be considered after holding the price below the level of 1.1565.
Trading plan for GBP/USD on November 10:
A narrow stagnation in the amplitude of 22 points (yellow rectangle) is likely to lead to speculation when the price goes beyond the specified borders of 1.3545/1.3567.
This will indicate a local entry towards the key values:
1.3567 --- > 1.3605
1.3545 --- > 1.3525
The main growth in trading volumes will occur after the price is kept outside the key levels of 1.3525/1.3605. This will indicate the subsequent course of the quote.

What is reflected in the trading charts?
A candlestick chart view is graphical rectangles of white and black light, with sticks on top and bottom. When analyzing each candle in detail, you will see its characteristics of a relative period: the opening price, closing price, and maximum and minimum prices.
Horizontal levels are price coordinates, relative to which a stop or a price reversal may occur. These levels are called support and resistance in the market.
Circles and rectangles are highlighted examples where the price of the story unfolded. This color selection indicates horizontal lines that may put pressure on the quote in the future.
The up/down arrows are the reference points of the possible price direction in the future.
¡Los informes analíticos de InstaForex lo mantendrá bien informado de las tendencias del mercado! Al ser un cliente de InstaForex, se le proporciona una gran cantidad de servicios gratuitos para una operación eficiente.


