empty
 
 
Está a punto de salir de
www.instaforex.eu >
un sitio web operado por
INSTANT TRADING EU LTD
Abrir cuenta

18.11.202110:05 Forex Analysis & Reviews: Indicator analysis. Daily review of EUR/USD on November 18, 2021

Esta información se proporciona a clientes minoristas y profesionales como parte de comunicación de marketing. No contiene y no debe interpretarse como asesoramiento o recomendación de inversión o una oferta o solicitud para participar en cualquier transacción o estrategia en instrumentos financieros. El desempeño pasado no garantiza o predice el desempeño futuro. Instant Trading EU Ltd. no asume ninguna representación ni responsabilidad sobre la precisión o integridad de la información proporcionada, o cualquier pérdida que surja de cualquier inversión basada en el análisis, pronóstico u otra información proporcionada por un empleado de la Compañía o de otra manera. El descargo de responsabilidad completo está disponible aquí.

Trend analysis (Fig. 1)

The price from the level of 1.1318 (closing of yesterday's daily candle) will try to start rising today in order to test the level of 1.1364 – the pullback level of 23.6% (blue dotted line). After this level is reached, it may further grow to the target of 1.1427 – the pullback level of 38.2% (blue dotted line).

Exchange Rates 18.11.2021 analysis

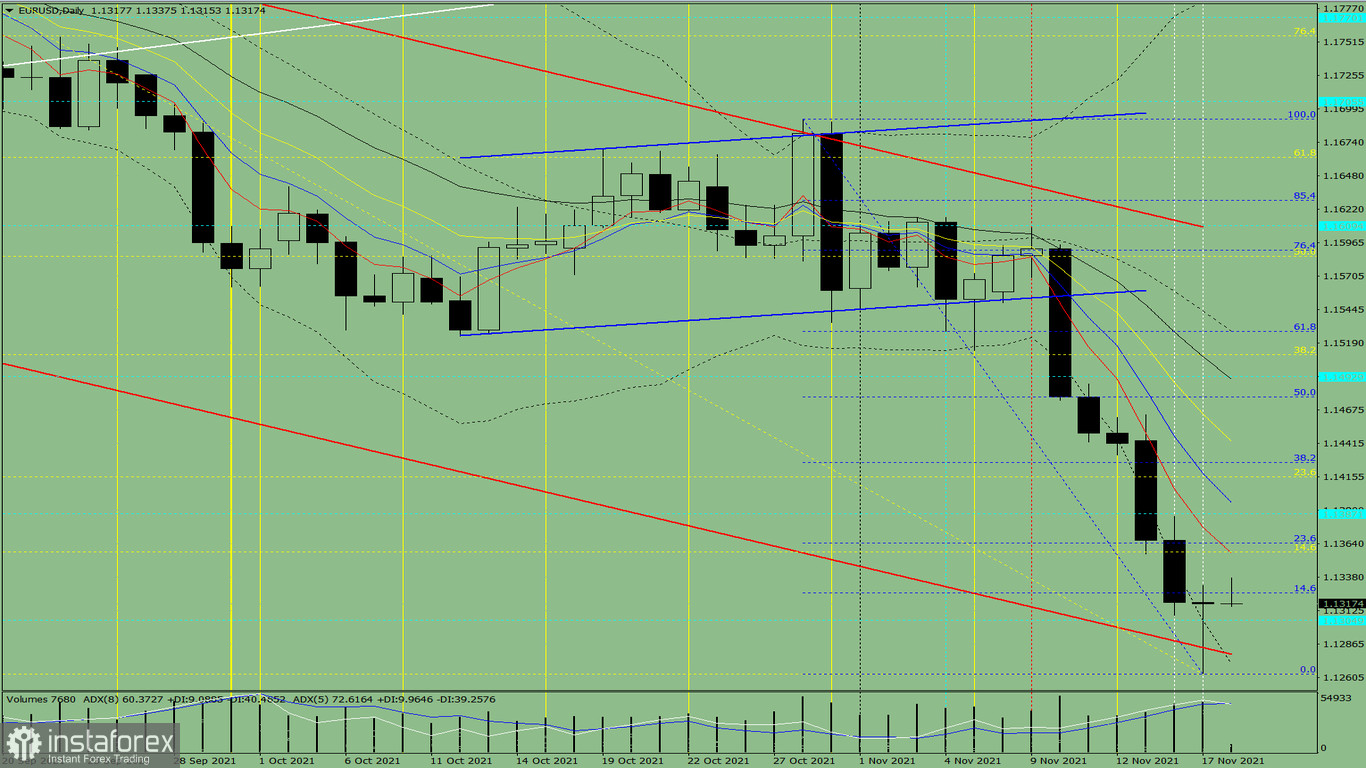
Figure 1 (daily chart)

Comprehensive analysis:

  • Indicator analysis - up
  • Fibonacci levels - up
  • Volumes - up
  • Candlestick analysis - up
  • Trend analysis - up
  • Bollinger lines - down
  • Weekly chart - up

General conclusion:

Today, the price from the level of 1.1318 (closing of yesterday's daily candle) will make an attempt to start increasing to test the level of 1.1364 – the pullback level of 23.6% (blue dotted line). After reaching it, the upward movement may resume to the target of 1.1427 – the pullback level of 38.2% (blue dotted line).

Alternatively, the price from the level of 1.1325 (closing of yesterday's daily candle) will try to continue declining with the goal of testing the lower fractal of 1.1263 (blue dotted line). When this level is reached, the price may start moving up to the target of 1.1326 – the pullback level of 14.6% (yellow dotted line).

Desarrollado por un Stefan Doll
experto de análisis de InstaForex
© 2007-2024

Abra una cuenta de operaciones

¡Los informes analíticos de InstaForex lo mantendrá bien informado de las tendencias del mercado! Al ser un cliente de InstaForex, se le proporciona una gran cantidad de servicios gratuitos para una operación eficiente.


Usted está ahora saliendo de www.instaforex.eu, un sitio web operado por INSTANT TRADING EU LTD
¿No puede hablar ahora mismo?
Ingrese su pregunta en el chat.

Turn "Do Not Track" off