 Permanecer
Condiciones de negociación
Products
Herramientas


Over the past Friday, the pressure on the dollar from the yen increased. The lower shadow on the daily scale chart tested the balance indicator line from above. The price divergence with the Marlin Oscillator is increasing. As before, we are waiting for the price at the nearest support at 113.18. Slightly below it is the MACD indicator line, at 112.74 - at the low of November 9, so the price can easily work out this support as well, while maintaining the potential for an upward reversal to the target range of 115.80-116.15. If the price settles below this level, the price may rush to the embedded price channel line of the higher timeframe in the region of 110.75.
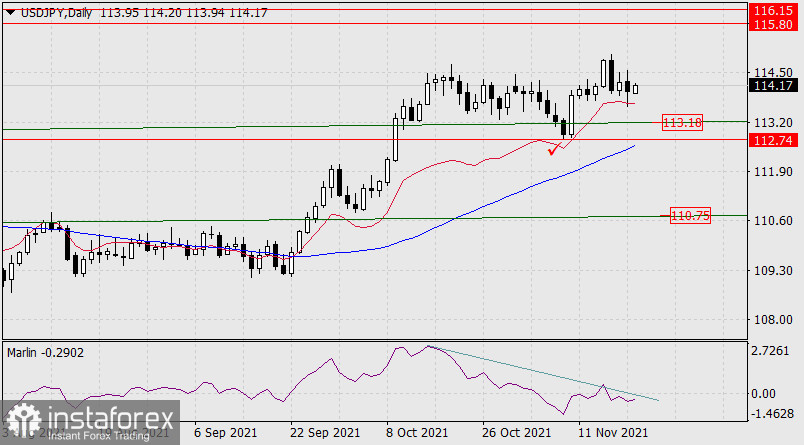
But this scenario has a drawback - it is a rebound of the price from the balance indicator line. If the price closes today with a white candle, the Marlin Oscillator may be in the positive zone tomorrow morning, breaking the line forming the divergence. In this case, the growth will continue, the price will go to the target range of 115.80-116.15.
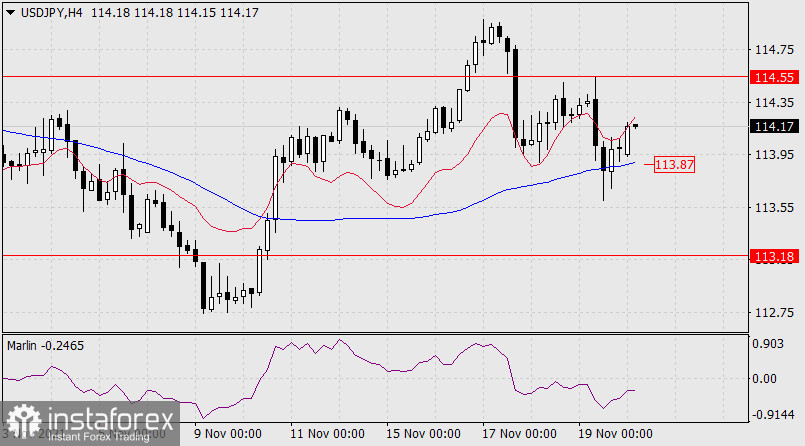
On a four-hour scale chart, the price turns up after falsely moving under the MACD line. After the price breaks above the level of 114.55 - above the Friday high, the Marlin Oscillator will be in the zone of positive values, which in total may mean a further rise in the price towards the specified target.
Consolidating below the MACD line (113.87) will be a signal for the price to return in a downward direction.
¡Los informes analíticos de InstaForex lo mantendrá bien informado de las tendencias del mercado! Al ser un cliente de InstaForex, se le proporciona una gran cantidad de servicios gratuitos para una operación eficiente.


