 Permanecer
Condiciones de negociación
Products
Herramientas


Trend analysis (pic. 1).
On Friday, the euro/dollar pair may jump from the level of 1.1207 (the closing of yesterday's daily candlestick), trying to reach the retracement level of 14.6%, 1.1260 (blue dotted line). After testing this level, it is likely to continue its upward movement to the target level of 1.1305, the retracement level of 23.6% (blue dotted line).
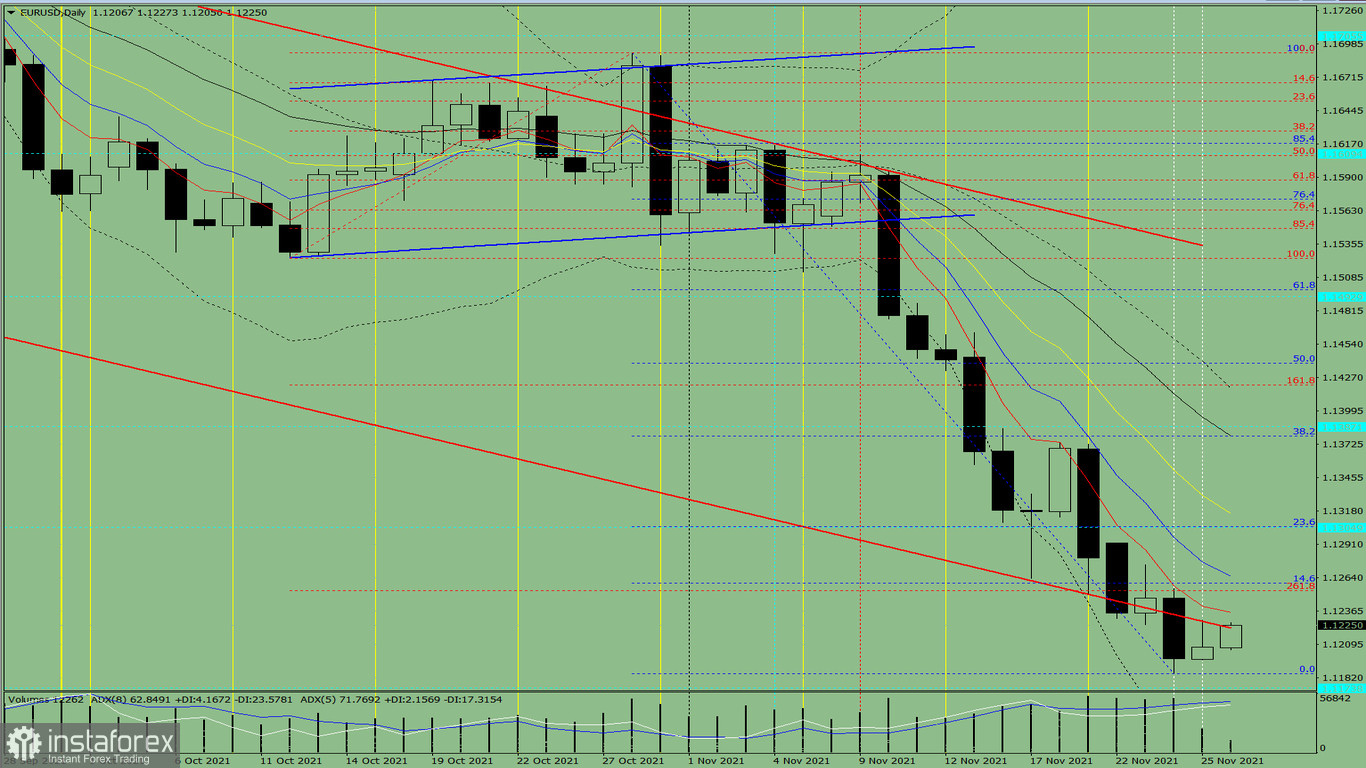
Pic. 1 (daily chart).
Complex analysis:
- technical indicators – up;
Fibonacci retracement levels - up;
- volumes - up;
- candlestick analysis - up;
- trend analysis - up;
- Bollinger lines - up;
- weekly chart-up.
Conclusion:
On Friday, the euro/dollar pair may jump from the level of 1.1207 (the closing of yesterday's daily candlestick), trying to reach the retracement level of 14.6%, 1.1260 (blue dotted line). After testing this level, it is likely to continue its upward movement to the target level of 1.1305 – the retracement level of 23.6% (blue dotted line).
An unlikely scenario is that the price may start moving up in order to reach the resistance level of 1.1223 (the red bold line) from the level of 1.1207 (the closing of yesterday's daily candlestick). After testing this level, it may decline to the target level of 1.1174, the historical support level (blue dotted line).
¡Los informes analíticos de InstaForex lo mantendrá bien informado de las tendencias del mercado! Al ser un cliente de InstaForex, se le proporciona una gran cantidad de servicios gratuitos para una operación eficiente.

