 Permanecer
Condiciones de negociación
Products
Herramientas


Trend analysis (Fig. 1).
On Monday the market from the closing level of Friday's daily candle 1.1316 may start a downward movement with the target of 1.1253, the target level of 261.8% (red dotted line). On testing this level, the price may start an up move with the target of 1.1305, a pullback level of 23.6% (blue dotted line). On reaching this level, the upside move with a target of 1.1378, a 38.2% pullback level (blue dotted line) is possible.
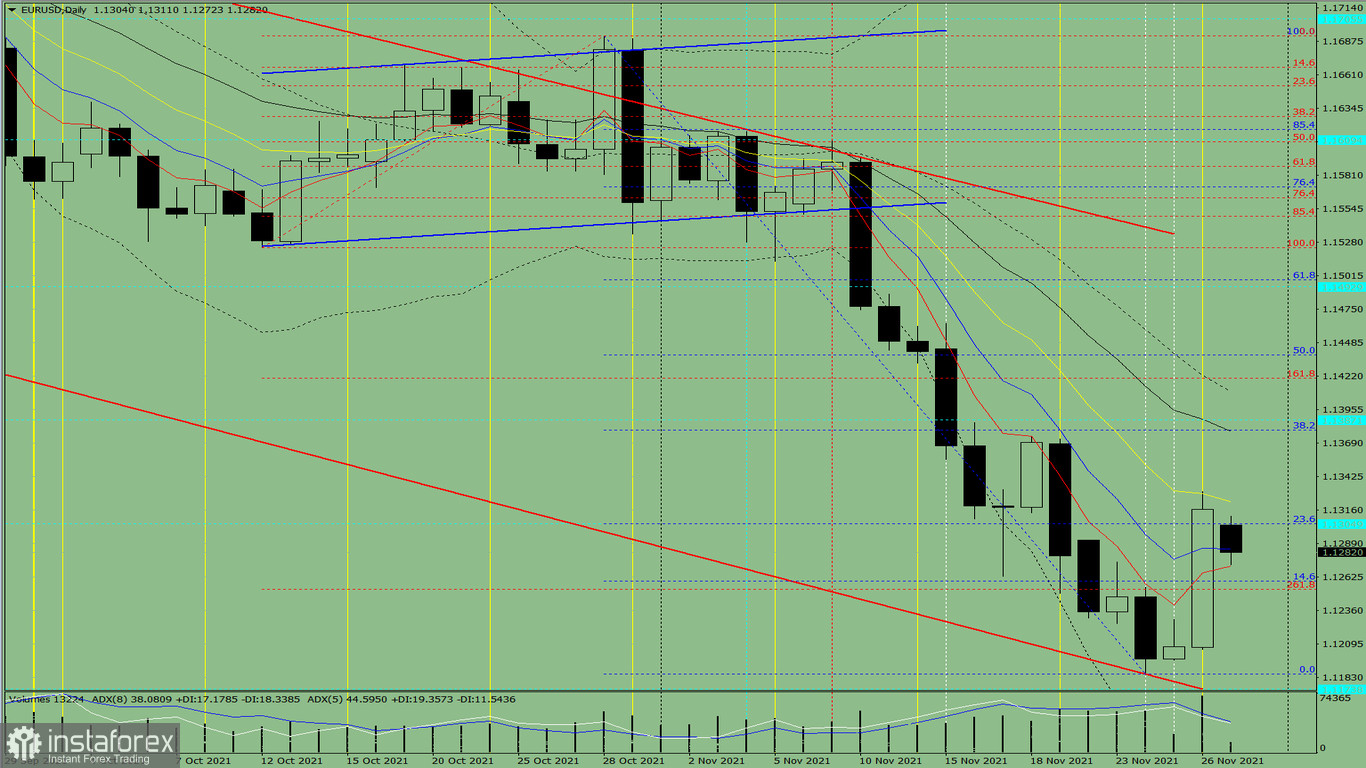
Figure 1 (daily chart).
Complex analysis:
- indicator analysis - downwards;
- Fibonacci levels - down;
- volumes - down;
- candlestick analysis - down;
- trend analysis - up;
- Bollinger bands - down;
- weekly chart - down.
Conclusion:
Today the price from 1.1316 may start moving downwards with the target 1.1253, the target level of 261.8% (red dotted line). On testing this level, the price may start an up move with the target 1.1305, a pullback level of 23.6% (blue dotted line). On reaching this level, the upper move with a target of 1.1378, the pullback level of 38.2% (blue dotted line), is possible.
Unlikely scenario: the price from the closing level of Friday's daily candle 1.1316 may continue upwards with the target 1.1378, a pullback level of 38.2% (blue dotted line).
If this level is tested, a lower move is possible with a target of 1.1329, 13 EMA (yellow thin line).
¡Los informes analíticos de InstaForex lo mantendrá bien informado de las tendencias del mercado! Al ser un cliente de InstaForex, se le proporciona una gran cantidad de servicios gratuitos para una operación eficiente.

