 Permanecer
Condiciones de negociación
Products
Herramientas


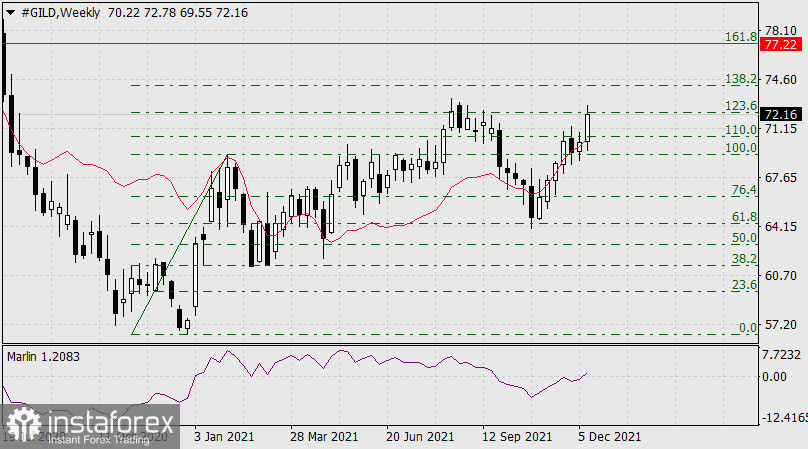
Purchase of Gilead Sciences (#GILD) shares, the US biopharmaceutical company.
On the weekly scale chart, the price consolidated above the balance indicator line. It made an attempt to break above the Fibonacci retracement level of 123.6%. The signal line of the Marlin oscillator is located in the positive zone. If the price approaches the Fibonacci level of 161.8% or 77.22, it will indicate the upward movement.
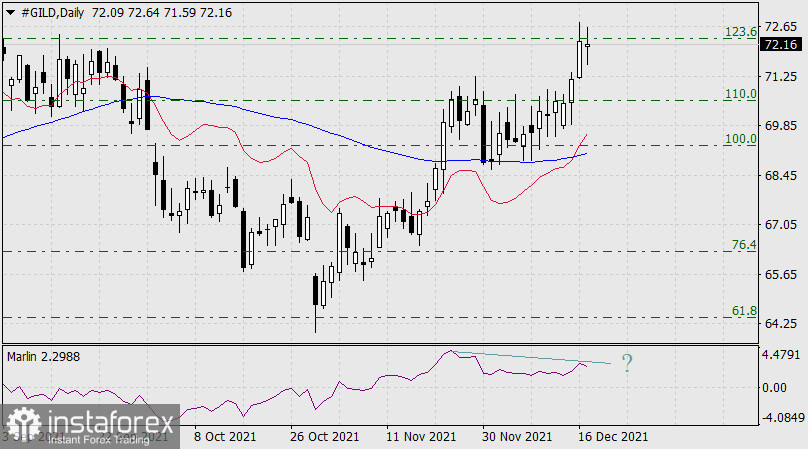
On the daily chart, the last five candlesticks were rising quickly. The last candlestick slowed down a bit at the Fibonacci level of 123.6%. However, the current dynamic facilitates further growth. There is one negative factor. The Marlin oscillator may form a reversal divergence. Even if it happens, there is a chance divergence may not occur. As a result, the Marlin indicator may continue to grow.
Short positions on UBS Group AG (#UBS) shares, the Swiss financial holding.
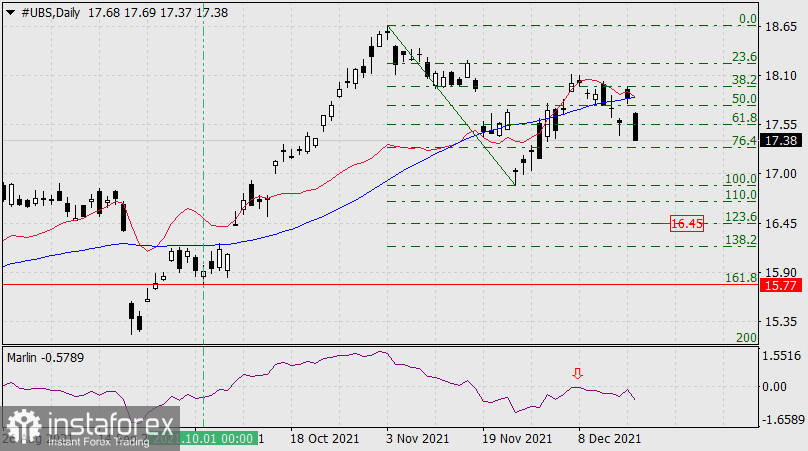
On the daily scale chart, the price held below the indicator trend line - the Kruzenshtern line. After a reversal from the positive zone (from the zero line) on December 8, the Marlin oscillator keeps dropping, entering the bearish trend. Technical indicators show a downward movement. The ultimate target level is the Fibonacci retracement level of 161.8% or 15.77. The nearest target level is situated at 16.45, the Fibonacci level of 123.6%.
¡Los informes analíticos de InstaForex lo mantendrá bien informado de las tendencias del mercado! Al ser un cliente de InstaForex, se le proporciona una gran cantidad de servicios gratuitos para una operación eficiente.


