 Permanecer
Condiciones de negociación
Products
Herramientas


Analysis of previous deals:
30M chart of the GBP/USD pair
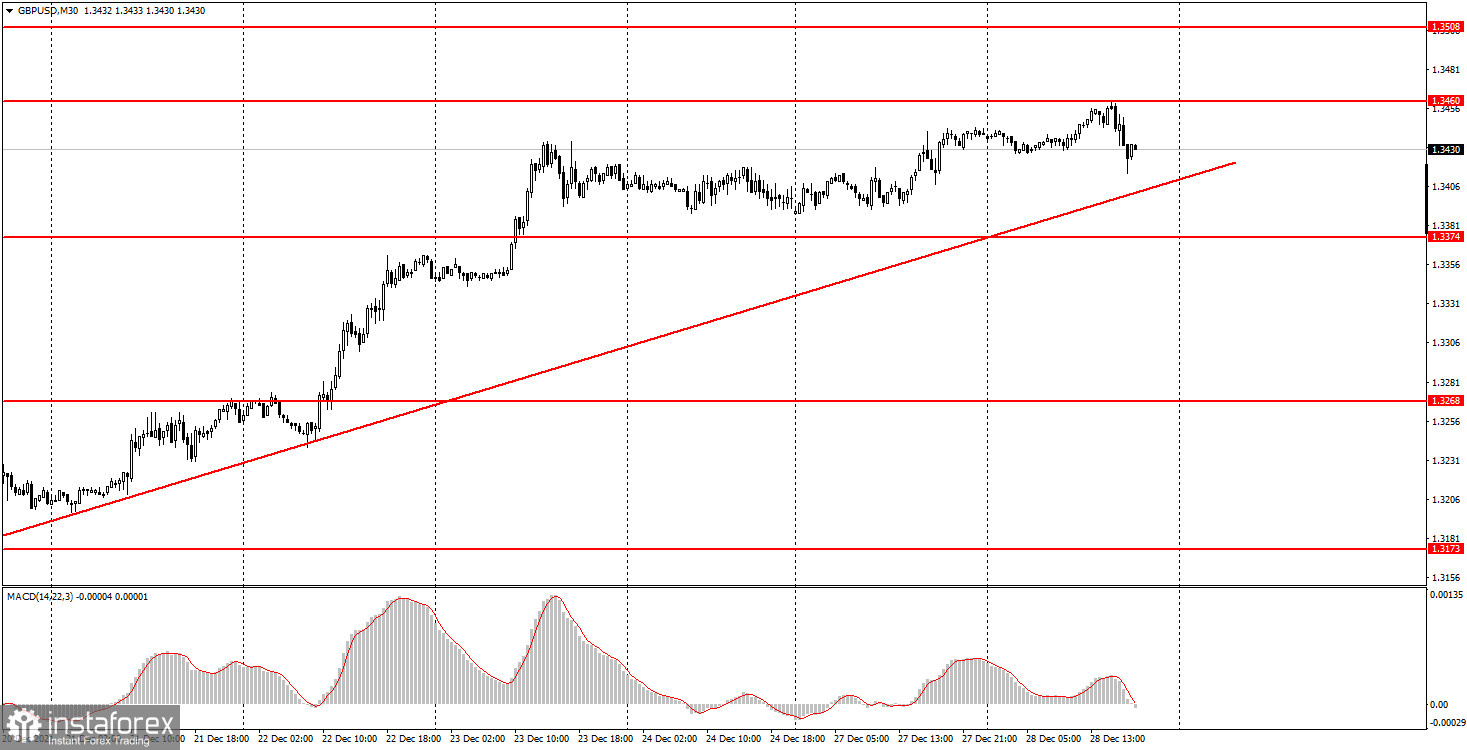
The GBP/USD pair did not trade in the best way on Tuesday, but it should be remembered that the "holidays" are continuing now, so it is hardly worth expecting a strong and trendy movement. The pound/dollar is already overfulfilling the plan. In the last week and a half, an upward trend has formed, which is supported by the trend line. At the moment, it is still relevant. A rebound from it can provoke a resumption of growth in the British currency. At the same time, consolidation below it may signal the completion of the pound's growth and a possible new fall. No important statistics have been released today in either the US or the UK. Volatility during the day was 47 points, which is actually very small.
5M chart of the GBP/USD pair
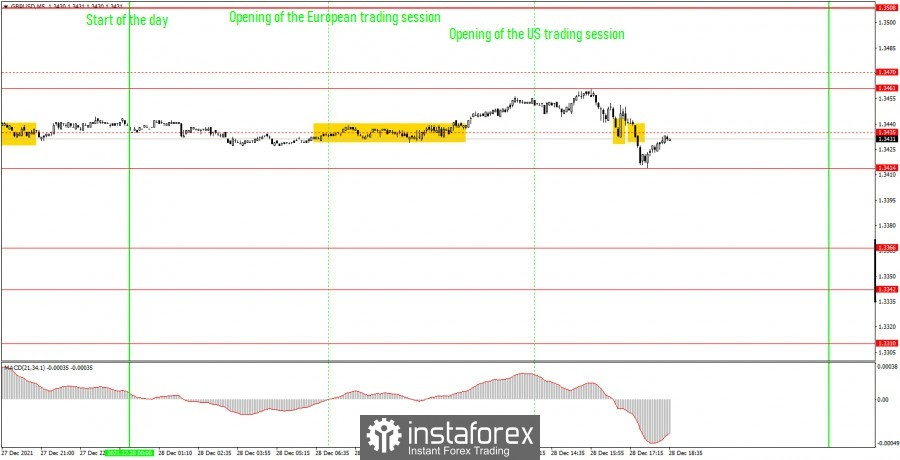
On the 5-minute timeframe, the movement of the pound/dollar pair on Tuesday was rather strange. At first, the price went up, then fell rather briskly. And these movements are almost impossible to correlate with any events of a fundamental nature. The levels shown in dotted lines in the chart are no longer relevant. Instead of them, levels 1.3414 and 1.3461 have been added. That is, they did not take part in today's trading, as they were formed only today. Thus, all trading signals of the day were formed around the 1.3435 level. Initially, the pair traded along this level for several hours, that is, the buy signal could hardly be called strong and clear, so it could be completely ignored. However, even if novice traders decided to work it out, the deal should have been closed by Stop Loss at breakeven, since the pair could not reach the nearest target level. The next buy signal in the form of a rebound from the level of 1.3435 should have alerted newcomers, since at that moment a candlestick of almost 20 points was formed (about half of the daily volatility). Therefore, long positions should not have been opened here either. The third signal - to sell - should also be ignored, since before that two false signals had already been formed near this level.
How to trade on Wednesday:
The upward trend continues at the 30-minute TF. Thus, in case of a clear price rebound from the trend line, we recommend opening long positions with 1.3460 as the target. And in case this level is surpassed, keep these deals open at the 5-minute TF. There are a sufficient number of levels on the lower chart, and the level of 1.3414 can still be updated if today's low is below it. In general, tomorrow it is recommended to trade at the levels of 1.3366, 1.3414, 1.3461, 1.3508. The fundamental background and macroeconomic events, it can be considered, will again be absent in both the UK and the US. Thus, novice traders will have nothing to analyze tomorrow. You can, of course, pay attention to the report on unfinished transactions for the sale of housing or on the balance of foreign trade, but the probability of their working out by the market is less than 10%. Based on this, volatility is likely to remain low. Whether the upward trend continues will depend on the behavior of the pair around the trend line.
On the chart:
Support and Resistance Levels are the Levels that serve as targets when buying or selling the pair. You can place Take Profit near these levels.
Red lines are the channels or trend lines that display the current trend and show in which direction it is better to trade now.
The MACD indicator consists of a histogram and a signal line. When they cross, this is a signal to enter the market. It is recommended to use this indicator in combination with trend lines (channels and trend lines).
Important speeches and reports (always contained in the news calendar) can greatly influence the movement of a currency pair. Therefore, during their exit, it is recommended to trade as carefully as possible or exit the market in order to avoid a sharp price reversal against the previous movement.
Beginners on Forex should remember that not every single trade has to be profitable. The development of a clear strategy and money management are the key to success in trading over a long period of time.
¡Los informes analíticos de InstaForex lo mantendrá bien informado de las tendencias del mercado! Al ser un cliente de InstaForex, se le proporciona una gran cantidad de servicios gratuitos para una operación eficiente.

