 Permanecer
Condiciones de negociación
Products
Herramientas


Analyzing trades on Wednesday:
EUR/USD on 30M chart
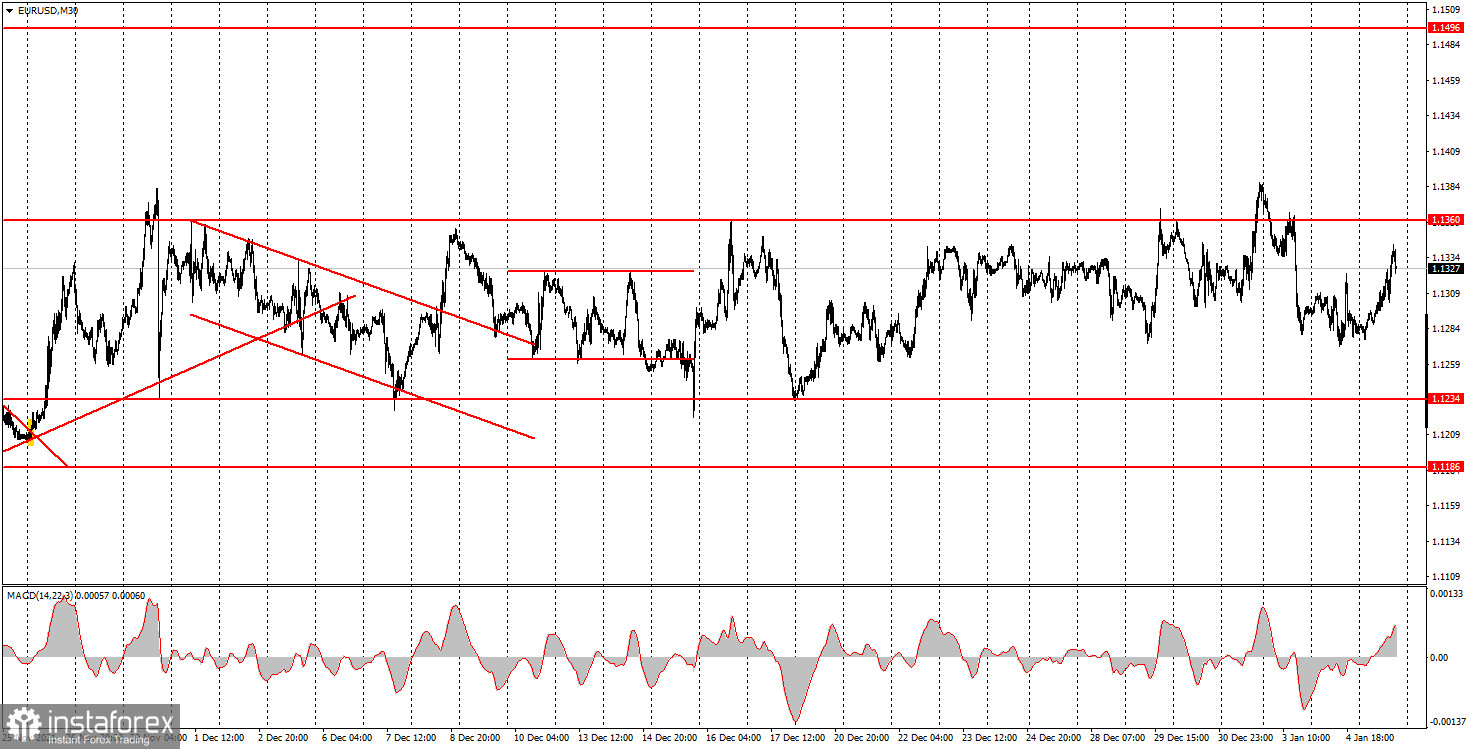
On Wednesday, the EUR/USD pair was still trading inside the sideways channel. We decided to reduce the scale of the time frame so that all movements of the pair would fit in the picture. Now you can clearly see how long the pair has been trading inside the flat channel. Each vertical line in the illustration represents one day. For more than a month, the pair has made two attempts to leave this range but they all failed. From a technical point of view, nothing has changed at this time. The pair is still trading flat and there is no clear trend. As for the fundamental background, the services PMI was published in the EU and the ADP employment change for December in the US. Despite the fact that the second report was quite important, and its actual reading was twice as high as forecasted by experts, the US dollar did not receive any support during the day. Actually, it does not matter now since the pair remains in the sideways channel.
EUR/USD on 5M chart
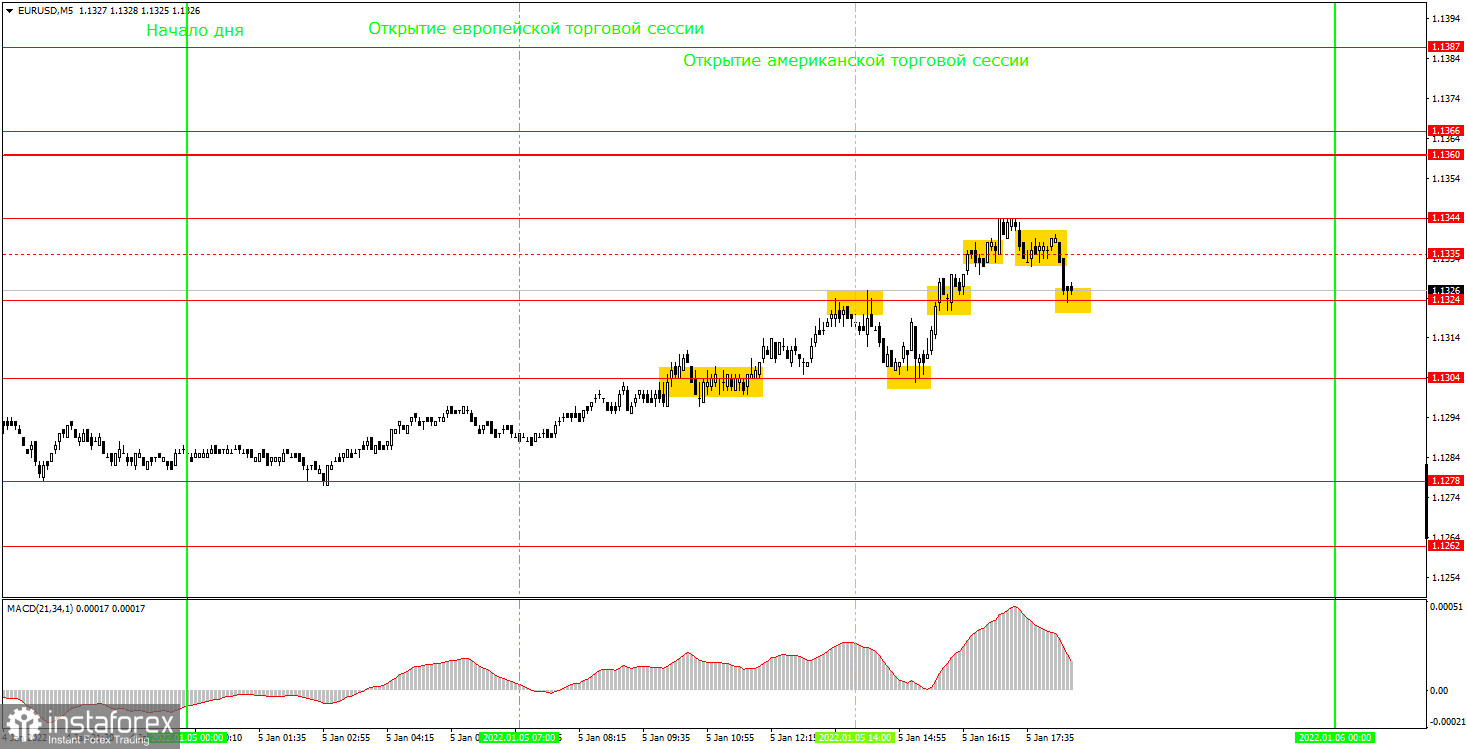
On the 5-minute time frame, the price movement was a bit more distinct. First, there was at least some hint of a trend. Secondly, the volatility was not so low which promised profitable trading signals. The level of 1.1335 lost its relevance and a new level of 1.1344 has been formed. It is the high of the day which still needs to be confirmed. The first buy signal was formed near the 1.1304 level after a breakout. At this point, traders could have opened long positions. Then, traders should have closed these positions near the level of 1.1324 where a rebound happened and should have opened short ones straight away. These sell trades should have been closed near the level of 1.1304 from which the pair rebounded as well. After that, new long positions should have been opened immediately. As a result, the first two trades brought us a profit of about 15 pips. The third buy trade generated more gains since the price broke through the levels of 1.1324 and 1.1335. This trade should have been closed manually upon reaching the level of 1.1324 with a profit of about 15 pips. Thus, in total, beginners could have earned about 30 pips which is a very good result for a flat movement on a 5-minute time frame.
Trading tips for Thursday
There is still a sideways channel on the 30-minute time frame although the pair had every chance of leaving it. However, the price is stuck between the levels of 1.1234 and 1.1360. There is still no trend at the moment and it is extremely difficult to trade on the current time frame. There are much more levels on the 5-minute time frame. On Thursday, we recommend trading from the following levels: 1.1278, 1.1304, 1.11324, 1.1344, and 1.1360-1.1366. We would like to remind you that it is necessary to set a Take Profit at 30-40 pips and a Stop Loss to a breakeven point as soon as the price passes 15 points in the right direction. Trades can also be closed manually near important levels or after the formation of an opposite signal. As for fundamental events and macroeconomic news on Thursday, we recommend that novice traders pay attention to the ISM business activity index in the US services sector.
On the chart
Support and Resistance Levels are the levels that serve as targets when buying or selling the pair. You can place Take Profit near these levels.
Red lines are channels or trend lines that display the current trend and show in which direction it is better to trade now.
The MACD indicator (14, 22, and 3) consists of a histogram and a signal line. When they cross, this is a signal to enter the market. It is recommended to use this indicator in combination with trend patterns (channels and trend lines).
Important announcements and economic reports that you can always find on the economic calendar can seriously influence the trajectory of a currency pair. Therefore, at the time of their release, we recommend trading as carefully as possible or exiting the market in order to avoid sharp price fluctuations.
Beginners on Forex should remember that not every single trade has to be profitable. The development of a clear strategy and money management is the key to success in trading over a long period of time.
¡Los informes analíticos de InstaForex lo mantendrá bien informado de las tendencias del mercado! Al ser un cliente de InstaForex, se le proporciona una gran cantidad de servicios gratuitos para una operación eficiente.


