 Permanecer
Condiciones de negociación
Products
Herramientas


Trend Analysis
This week, the price from the level of 1.1415 (closing of the last weekly candle) may continue upward movement with the target of 1.1488, 21 middle EMA (thin black line). If this line is tested, a further upper movement with the target of 1.1598, a 38.2% pullback level (blue dotted line) is likely. If this level is tested, a downward pullback is possible.
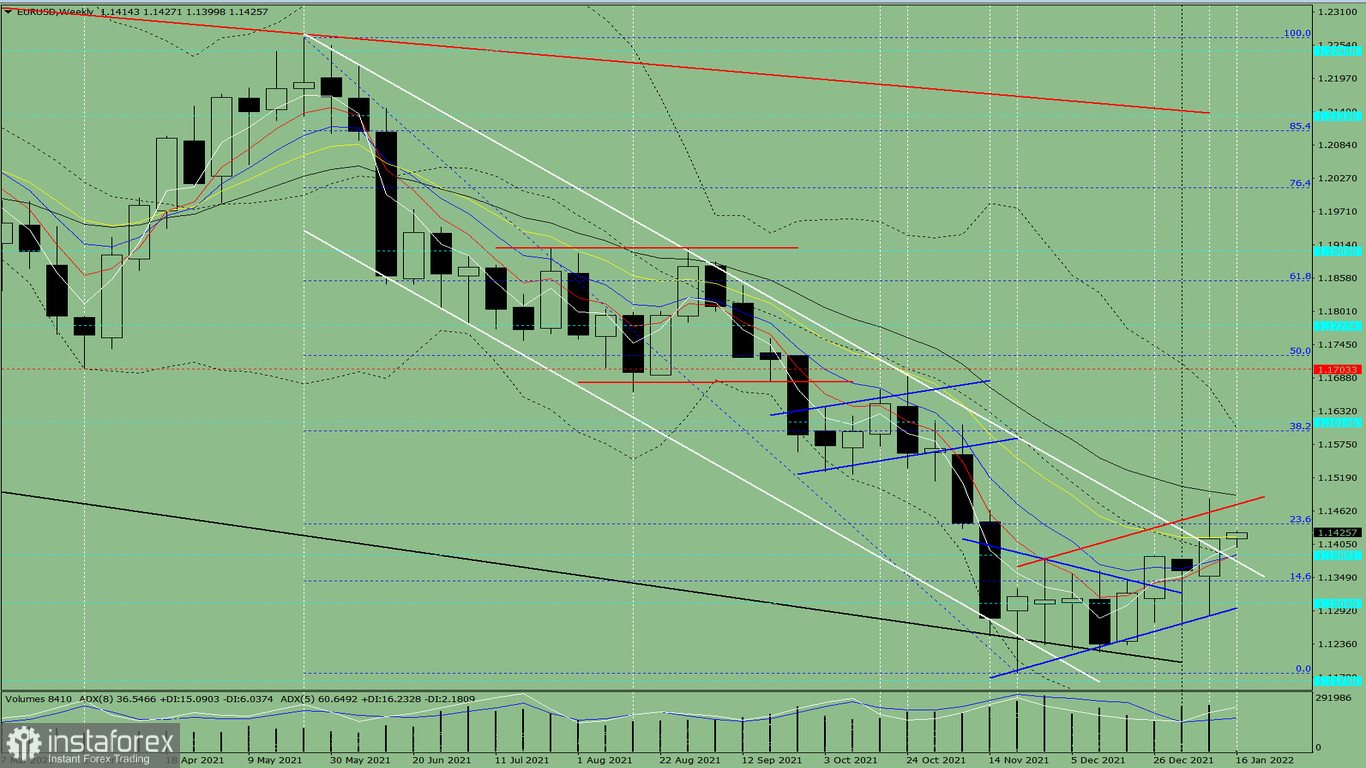
Fig. 1 (weekly chart)
Complex analysis:
- indicator analysis - uptrend;
- Fibonacci levels - uptrend;
- volumes - uptrend;
- candlestick analysis - uptrend;
- trend analysis - uptrend;
- Bollinger bands - downtrend;
- monthly chart - uptrend.
The conclusion of the complex analysis: upward movement.
The overall result of the calculation of the EUR/USD pair candlestick according to the weekly chart: the price is likely to have an upward trend this week with no lower shadow of the weekly white candlestick (Monday - uptrend) and no upper shadow (Friday - uptrend).
On the week the price from the level of 1.1415 (last week's candlestick close) may continue to move upwards with the target of 1.1488, 21 middle EMA (thin black line). If this line is tested, a further upper movement with the target 1.1598, a 38.2% pullback level (blue dotted line) is likely. If this level is tested, a downward pullback is possible.
Another possible scenario: the price from the level of 1.1415 (last week's candlestick close) may start a downward movement, aiming to reach the support line of 1.1297 (blue dotted line). If this line is reached, the upper movement with the target of 1.1387, historical resistance level (blue dotted line) is possible. In case this level is tested, uptrend is likely.
¡Los informes analíticos de InstaForex lo mantendrá bien informado de las tendencias del mercado! Al ser un cliente de InstaForex, se le proporciona una gran cantidad de servicios gratuitos para una operación eficiente.


