 Permanecer
Condiciones de negociación
Products
Herramientas

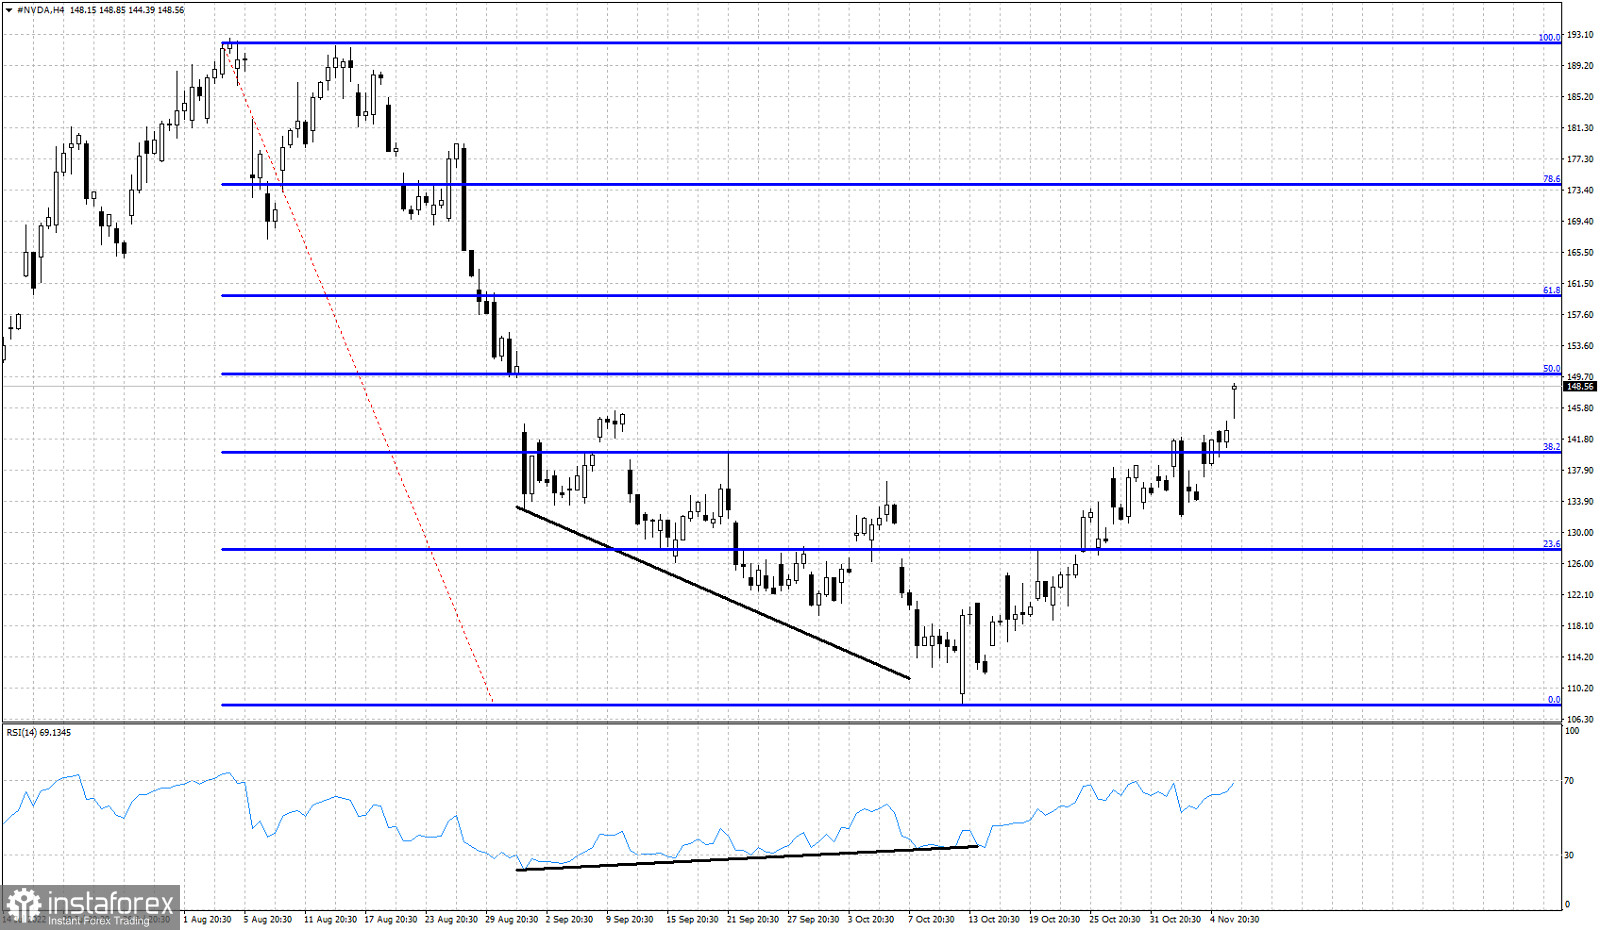
Blue lines- Fibonacci retracements
Black lines- RSI bullish divergence
On October 10th we posted our analysis on NVDA stock when price was trading around $120. We then noted that although trend remained bearish, there were increased chances of a bounce higher. The following days after we posted our analysis, NVDA stock price made a new lower low around $108.15 and started an upward bounce. So far price has retraced nearly 50% of the decline from $192.68. Price has started making higher highs and higher lows. The momentum in the near term is bullish. Next resistance level is at $150 and next at $159.90. Support is found at $131.80.
¡Los informes analíticos de InstaForex lo mantendrá bien informado de las tendencias del mercado! Al ser un cliente de InstaForex, se le proporciona una gran cantidad de servicios gratuitos para una operación eficiente.


