 Permanecer
Condiciones de negociación
Products
Herramientas


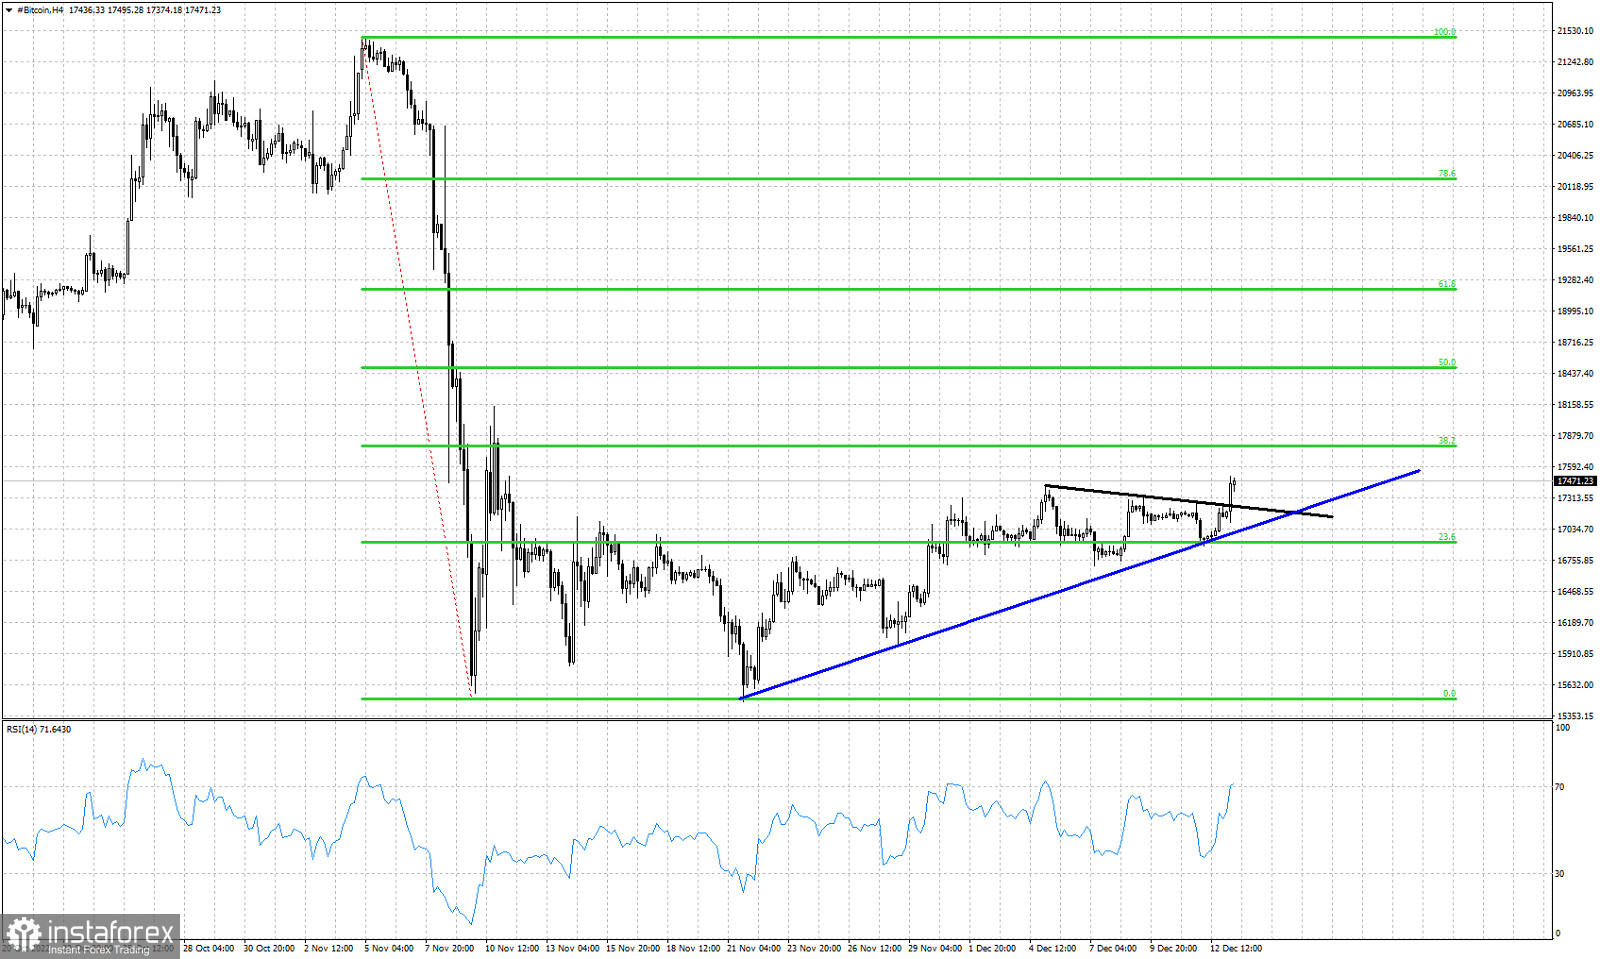
Blue line- support trend line
Black line- resistance trend line (broken)
Green lines- Fibonacci retracements
Bitcoin has broken the short-term resistance trend line at $17,200. Price has provided a new bullish signal and we are now expecting to see a test of the 38% Fibonacci retracement at $17,800. Bitcoin hasn't seen this price level since November 10th. The 38% Fibonacci retracement is the first important Fibonacci resistance. A break above this level would be a bullish sign that could lead to a bigger bounce towards the 61.8% retracement at $19,200. Support is found at $17,00 and as long as price is above this level, bulls will remain in control of the short-term trend. Bulls do not want to see a long upper tail candlestick pattern. They need to keep price above $17,200 and if the $17,800 level is reached, they will need to stay above it. The RSI is making new short-term higher highs, implying that the bullish momentum is strong.
¡Los informes analíticos de InstaForex lo mantendrá bien informado de las tendencias del mercado! Al ser un cliente de InstaForex, se le proporciona una gran cantidad de servicios gratuitos para una operación eficiente.

