 Permanecer
Condiciones de negociación
Products
Herramientas


Picture 1: trend analysis
From the closing level of the last weekly candlestick at 1.0545, EUR/USD could try to continueits down move aiming to test the lower fractal of 1.0471 plotted by the red line. From that level, the price could its upward move with the target at 1.0619, the 14.6% retracement level plotted by the red dotted line. Once this level is tested, could again resume its down move.
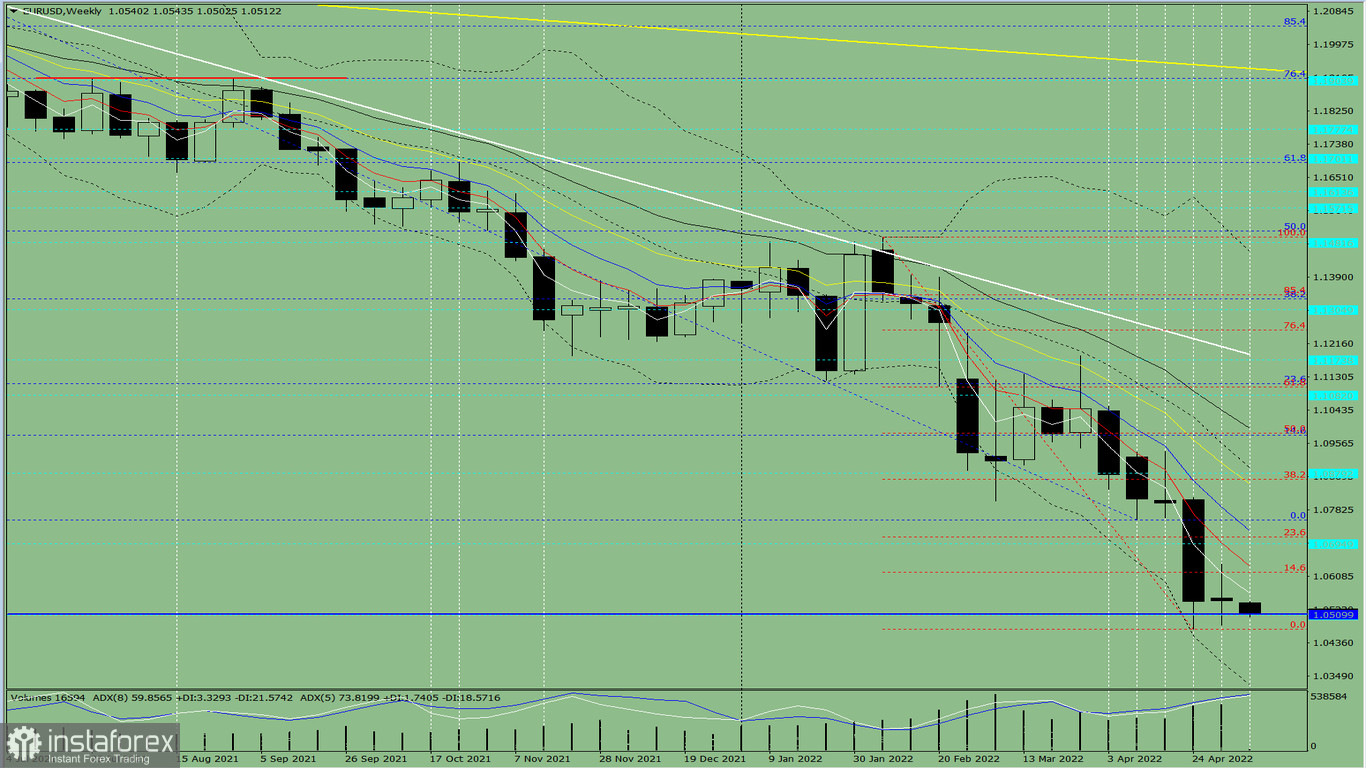
Weekly chart
Complex analysis
Indicator analysis – upFibonacci levels – upTrade volume – upCandlestick analysis – upTrend analysis – upBollinger bands – upMonthly chart – up
Complex analysis suggests an upward move.
The overall conclusion for the EUR/USD's candlestick on the weekly chart is that the trajectory for the week ahead is likely to be upward with the first lower shadow of the weekly white candlestick pointed downward on Monday and the second upper shadow pointed downward on Friday.
From the closing level of the last weekly candlestick at 1.0545, EUR/USD could try to continue its down move aiming to test the lower fractal of 1.0471 plotted by the red line. From that level, the price could its upward move with the target at 1.0619, the 14.6% retracement level plotted by the red dotted line. Once this level is tested, could again resume its down move.
Alternative scenario. From the closing price of the last weekly candlestick at 1.0545, the currencypair could try to extend its down move aiming to test the lower border of the Bollinger bands at 1.0326 plotted by the black dotted line. Once this level is reached, the price could begin its upward reversal with the target at 1.0620 that matches the 14.6% retracement level plotted by the red plotted line.
¡Los informes analíticos de InstaForex lo mantendrá bien informado de las tendencias del mercado! Al ser un cliente de InstaForex, se le proporciona una gran cantidad de servicios gratuitos para una operación eficiente.


