 Permanecer
Condiciones de negociación
Products
Herramientas


ETH/USD rebounded in the short term and now is trading at 1,635 at the time of writing. Still, the bounce back could be a short-lived one. After its strong sell-off, the rate could try to test and retest the near-term resistance levels before going down again.
Ethereum increased by 2.42% from yesterday's low of 1,608 to 1,647 today's high. Technically, the price action developed a bullish continuation pattern but this is far from being confirmed.
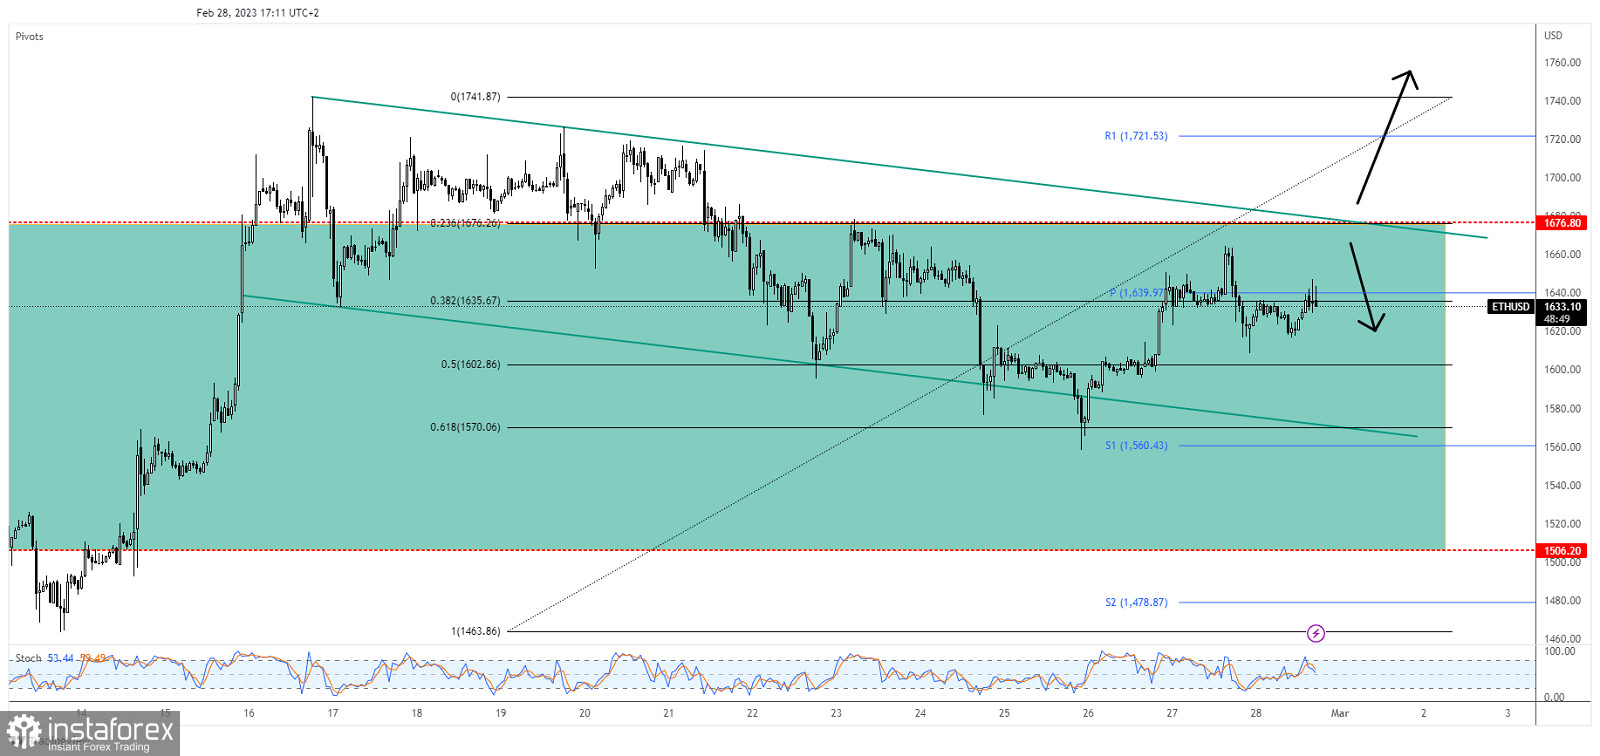
ETH/USD found support at the 61.8% (1,570) retracement level and it has turned to the upside. Now, it challenges the 38.2% Fibonacci level (1,635) and the pivot point of 1,639. 1,676 and the downtrend line represent resistance levels.
As you already know from my analyses, the down channel represents a bullish pattern. Still, only a valid breakout above the downtrend line and through 1,676 activates it.
Testing and retesting the downtrend line and the 1,676 static resistance, registering only false breakouts may announce a new sell-off. Only a valid breakout above these levels activates a larger growth and brings new long opportunities.
¡Los informes analíticos de InstaForex lo mantendrá bien informado de las tendencias del mercado! Al ser un cliente de InstaForex, se le proporciona una gran cantidad de servicios gratuitos para una operación eficiente.


