 Permanecer
Condiciones de negociación
Products
Herramientas


Trend analysis (Fig. 1).
On Thursday, the price may go up from 1.2144 (closing of yesterday's daily candlestick) to the 76.4% retracement level of 1.2196 (red dotted line). Should the quote test this mark, it may then rise to the 85.4% retracement level of 1.2247 (red dotted line) and extend the uptrend.
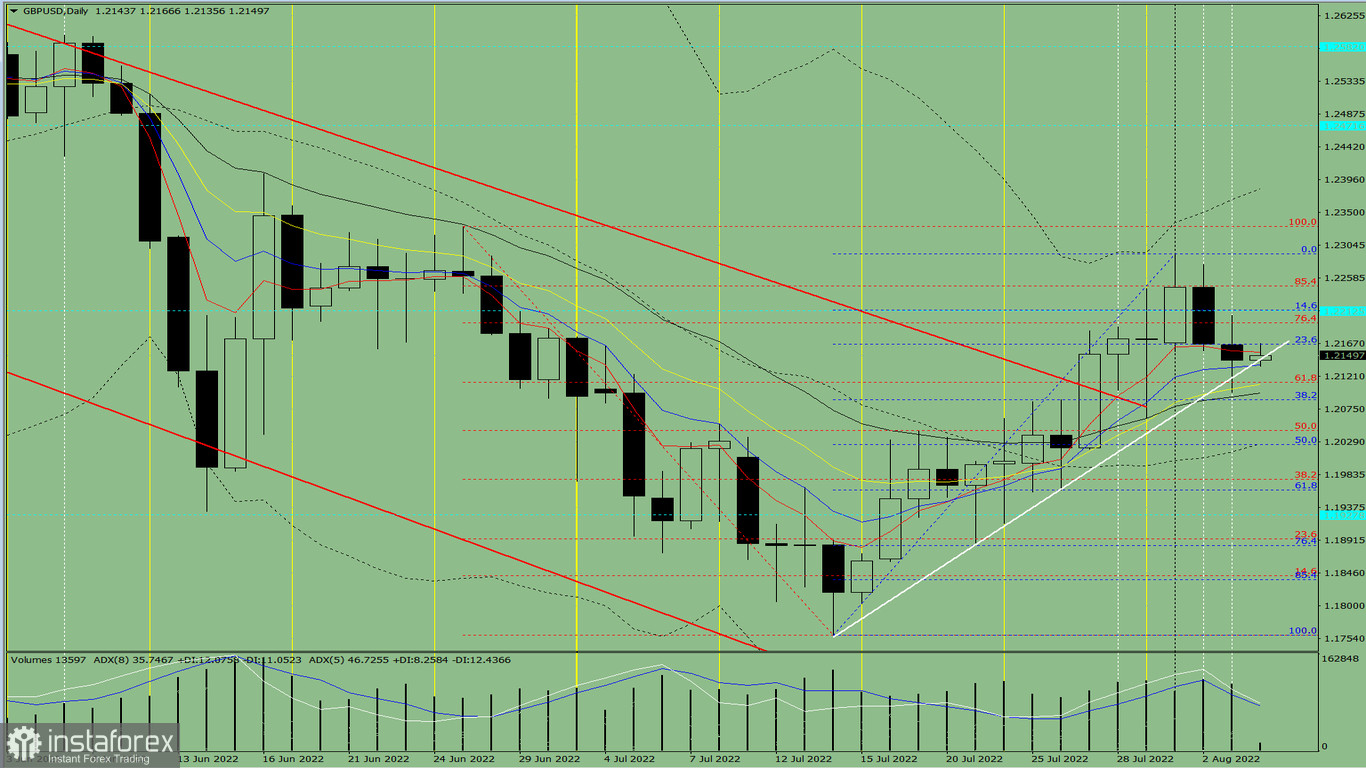
Fig. 1 (daily chart).
Complex analysis:
- indicator analysis - down
- Fibonacci levels - down
- volumes - down
- candlestick analysis - up
- trend analysis - up
- Bollinger bands - up
- weekly chart - up
Final thoughts:
On Thursday, the price may go up from the mark of 1.2144 (closing of yesterday's daily candlestick) to the 76.4% retracement level of 1.2196 (red dotted line). Should the quote test this mark, it may then rise to the 85.4% retracement level of 1.2247 (red dotted line) and extend the uptrend.
Alternative scenario: the price may go up from the mark of 1.2144 (closing of yesterday's daily candlestick) to the 76.4% retracement level of 1.2196 (red dotted line). Should the quote test this mark, a pullback may occur to the 38.2% retracement level of 1.2084 (blue dotted line), and then the uptrend could extend.
¡Los informes analíticos de InstaForex lo mantendrá bien informado de las tendencias del mercado! Al ser un cliente de InstaForex, se le proporciona una gran cantidad de servicios gratuitos para una operación eficiente.

