 Permanecer
Condiciones de negociación
Products
Herramientas


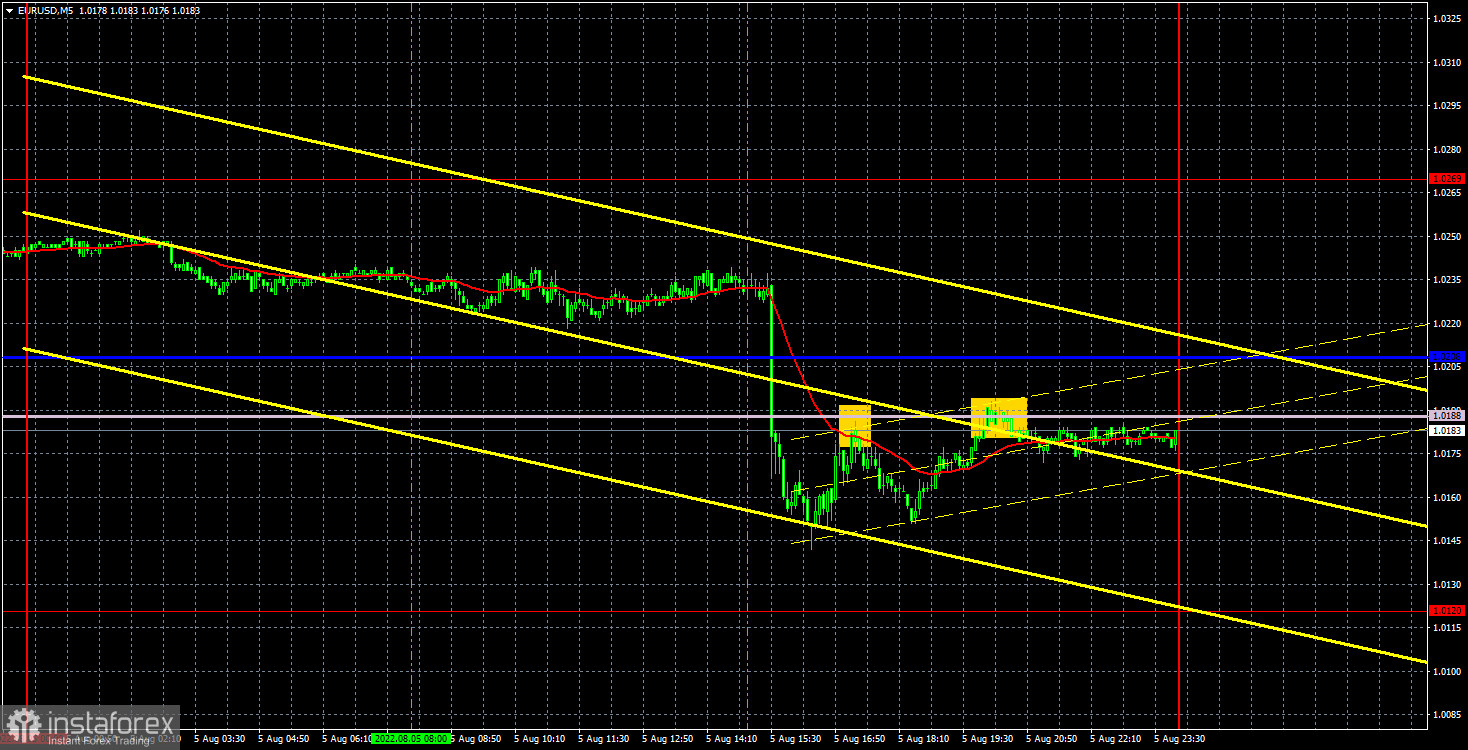
Last Friday, the EUR/USD pair collapsed by 90 points at once, and the rest of the time it was trading quite calmly. However, even a drop of 90 points within an hour does not really matter for the current technical picture, since it happened within the horizontal channel of 1.0120-1.0269, which we have been writing about in recent weeks in all articles. Thus, the US Nonfarm data turned out to be very strong, we personally did not expect such a high value of the report; the unemployment rate has fallen further and now stands at 3.5%; however, all these statistics do not really matter for the euro/dollar pair, since the flat has been persisting for almost a month. Naturally, important macroeconomic statistics are worked out by the market, but traders cannot or do not want to restore the trend movement yet. Therefore, we still believe that the euro does not have the necessary grounds for growth, so the long-term downward trend will resume sooner or later. As for the horizontal channel, most likely the price will leave it at the most unexpected moment, when it will not be preceded by any important event.
In fact, the movement was observed only in the US trading session. First, the quotes fell by almost 100 points, and then a gradual recovery began. As a result, we did not even begin to select sell signals near the Kijun-sen and Senkou Span B lines, since in any case it was impossible to work them out in time. The pair bounced twice from the Senkou Span B line and it was possible to try to work out the first rebound. However, the short position was closed by Stop Loss at breakeven. The second sell signal was formed too late to be traded.
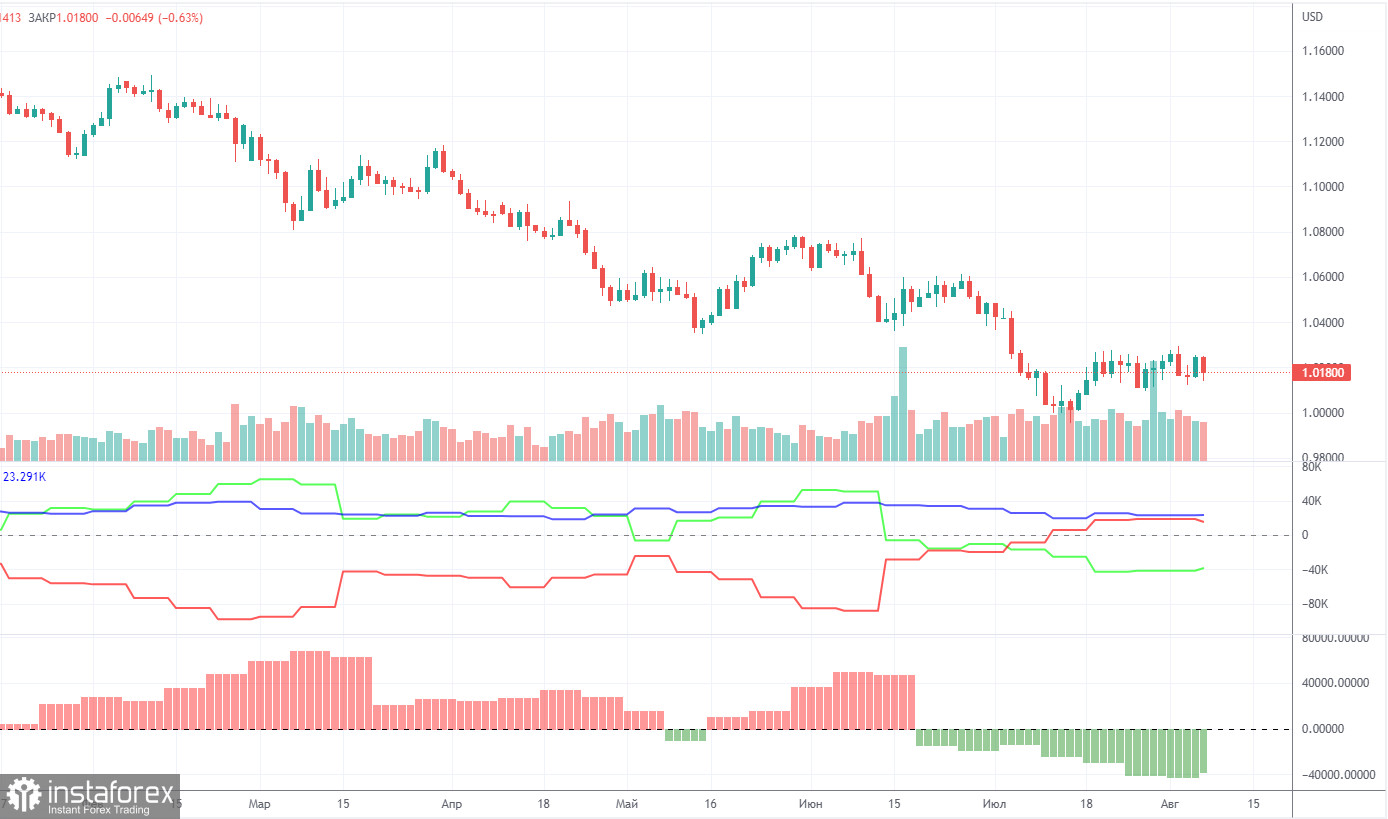
The Commitment of Traders (COT) reports on the euro over the past six months have raised a huge number of questions. The chart above clearly shows that for most of 2022 they showed an open bullish mood of professional players, but at the same time, the euro was falling at the same time. At this time, the situation has changed, but NOT in favor of the euro. If earlier the mood was bullish, and the euro was falling, now the mood is bearish and... the euro is also falling. Therefore, for the time being, we do not see any grounds for the euro's growth, because the vast majority of factors remain against it. During the reporting week, the number of long positions decreased by 6,300, while the number of shorts in the non-commercial group decreased by 9,100. Accordingly, the net position increased by about 3,000 contracts, which is a meager change. The mood of the big players remains bearish and has steadily intensified in recent weeks. From our point of view, this fact very eloquently indicates that at this time even commercial traders do not believe in the euro. The number of longs is lower than the number of shorts for non-commercial traders by 39,000. Therefore, we can state that not only the demand for the US dollar remains high, but also the demand for the euro is quite low. This may lead to a new, even greater fall of the euro. Over the past six months or a year, the euro has not been able to show even a tangible correction, not to mention something more. The highest upward movement was about 400 points. Over the past three weeks, the pair has managed to correct by 300 points.
Overview of the EUR/USD pair. August 8. The week will be boring, but perhaps this is exactly what is needed to complete the flat?
Overview of the GBP/USD pair. August 8. Has the market already decided on a new trend? Or should we wait for the US inflation report?
Forecast and trading signals for GBP/USD on August 8. Detailed analysis of the movement of the pair and trading transactions.
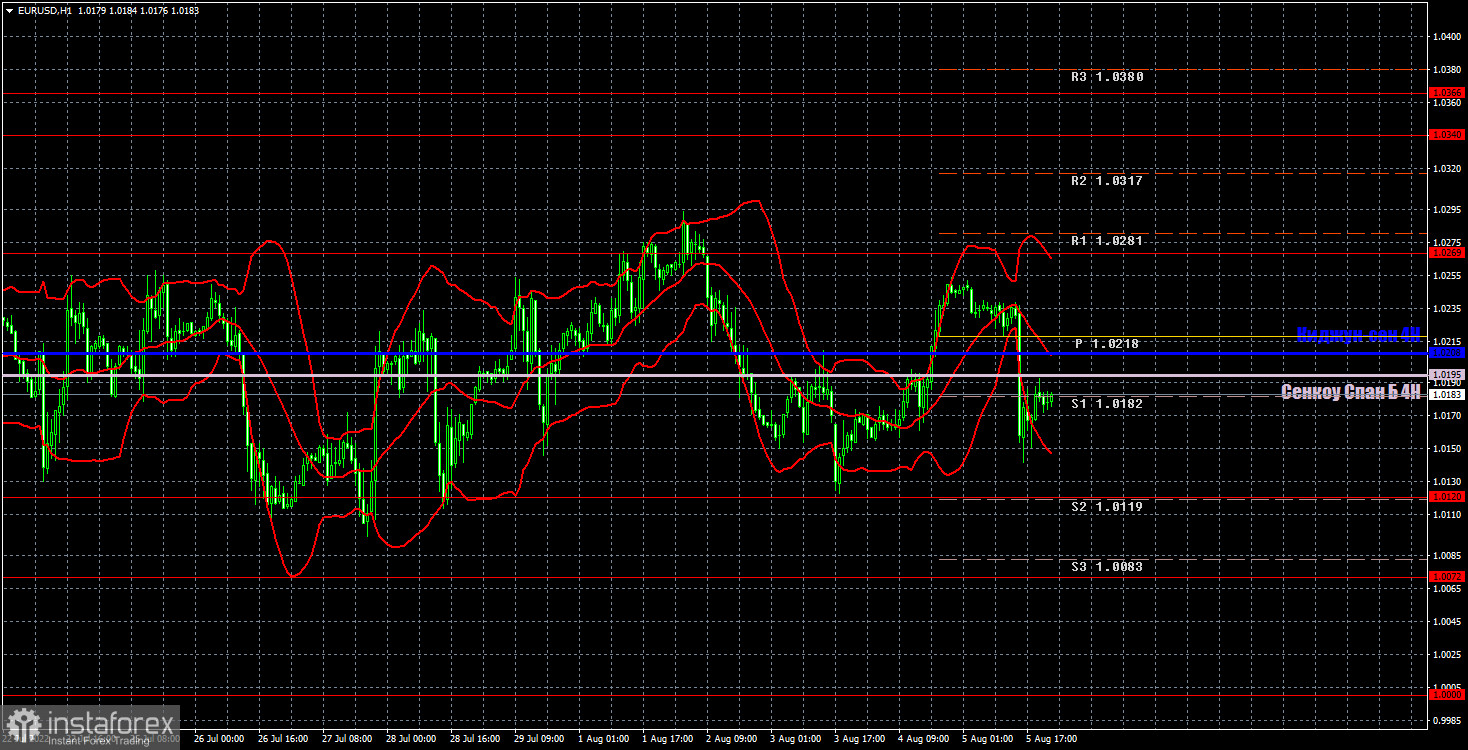
The pair continues to trade between the levels of 1.0120 and 1.0269 on the hourly timeframe. Thus, the flat remains and can continue for as long as you like. The Ichimoku indicator lines are not strong at the moment, so false signals may form around them. We highlight the following levels for trading on Monday - 1.0000, 1.0072, 1.0120, 1.0269, 1.0340-1.0366, 1.0485, as well as Senkou Span B (1.0195) and Kijun-sen lines (1.0208). Ichimoku indicator lines can move during the day, which should be taken into account when determining trading signals. There are also secondary support and resistance levels, but no signals are formed near them. Signals can be "rebounds" and "breakthrough" extreme levels and lines. Do not forget about placing a Stop Loss order at breakeven if the price has gone in the right direction for 15 points. This will protect you against possible losses if the signal turns out to be false. No important publication or fundamental event planned in the European Union and the United States on August 8. There will definitely be nothing for traders to react during the day. However, this does not mean that the pair will stand in one place. It can continue to move very volatile within the horizontal channel.
Support and Resistance Levels are the levels that serve as targets when buying or selling the pair. You can place Take Profit near these levels.
Kijun-sen and Senkou Span B lines are lines of the Ichimoku indicator transferred to the hourly timeframe from the 4-hour one.
Support and resistance areas are areas from which the price has repeatedly rebounded off.
Yellow lines are trend lines, trend channels and any other technical patterns.
Indicator 1 on the COT charts is the size of the net position of each category of traders.
Indicator 2 on the COT charts is the size of the net position for the non-commercial group.
¡Los informes analíticos de InstaForex lo mantendrá bien informado de las tendencias del mercado! Al ser un cliente de InstaForex, se le proporciona una gran cantidad de servicios gratuitos para una operación eficiente.


