 Permanecer
Condiciones de negociación
Products
Herramientas


Trend analysis (fig. 1).
This week, the pair is likely to rebound from 1.0184 (closing of the last weekly candlestick) in order to reach the retracement level of 38.2% - 1.0268 (yellow dotted line). From this level, the pair will try to approach the retracement level of 50.0%, 1.0367 (yellow dotted line). When testing this level, the price may start declining to the target level of 1.0269 – the 8 EMA (blue thin line). The price is likely to rise higher from this level. From this line, the upward movement will continue.
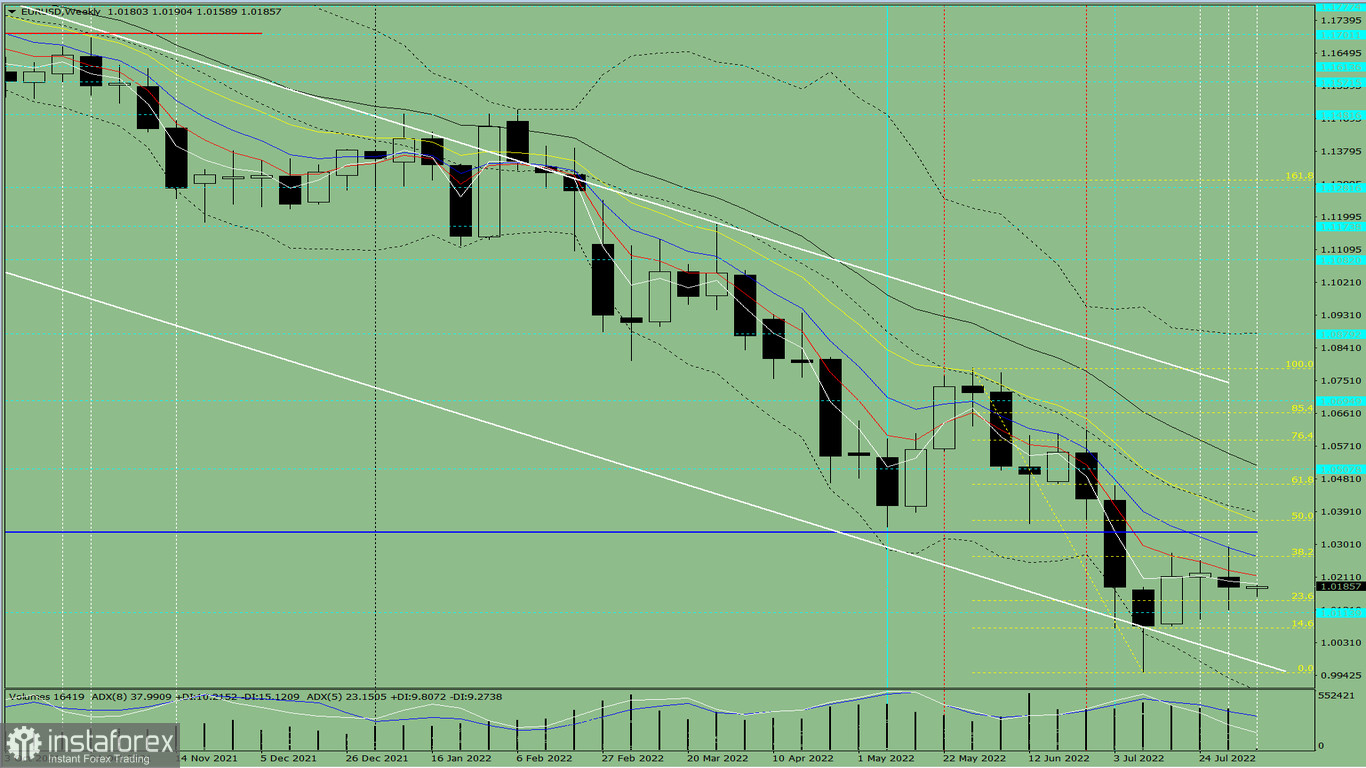
Fig. 1 (weekly chart).
Complex analysis:
-indicator analysis– up;- Fibonacci retracement levels – up;- trading volumes – up;- candlestick analysis – up;- trend analysis – up;- Bollinger bands – up;- monthly chart-up.
Judging by the indicators, the pair is likely to start an upward movement
The candlestick of the EUR/USD pair according to the weekly chart: during the week the price may advance with the absence of the first lower shadow of the weekly white candlestick (Monday – up) and the absence of the second upper shadow (Friday – up).
This week, the pair is likely to rebound from 1.0184 (closing of the last weekly candlestick) in order to reach the retracement level of 38.2% – 1.0268 (yellow dotted line). From this level, the pair will try to approach the retracement level of 50.0%, 1.0367 (yellow dotted line). When testing this level, the price may start declining to the target level of 1.0269 – the 8 EMA (blue thin line). The price is likely to rise higher from this level. From this line, the upward movement will continue.
Alternatively, the pair may decline from the level of 1.0184 (closing of the last weekly candlestick) to the support level of 0.9976 (white bold line). From this line, it could try to rebound. If so, it may test the Fibonacci retracement level of 14.6%, 1.0071 (yellow dotted line).
¡Los informes analíticos de InstaForex lo mantendrá bien informado de las tendencias del mercado! Al ser un cliente de InstaForex, se le proporciona una gran cantidad de servicios gratuitos para una operación eficiente.

