 Permanecer
Condiciones de negociación
Products
Herramientas


Trend analysis (picture 1)
On Wednesday, EUR/USD could begin a downward move from 1.0211, the closing level of yesterday's daily candlestick, with the target at 1.0181 that coincides with support plotted by the white bold line. Once this level is tested, the price may reverse upwards with the target at 1.0281 that matches the 50.0% Fibonacci retracement plotted by the red dotted line. As soon as this level is reached, the trading instrument will go down again.
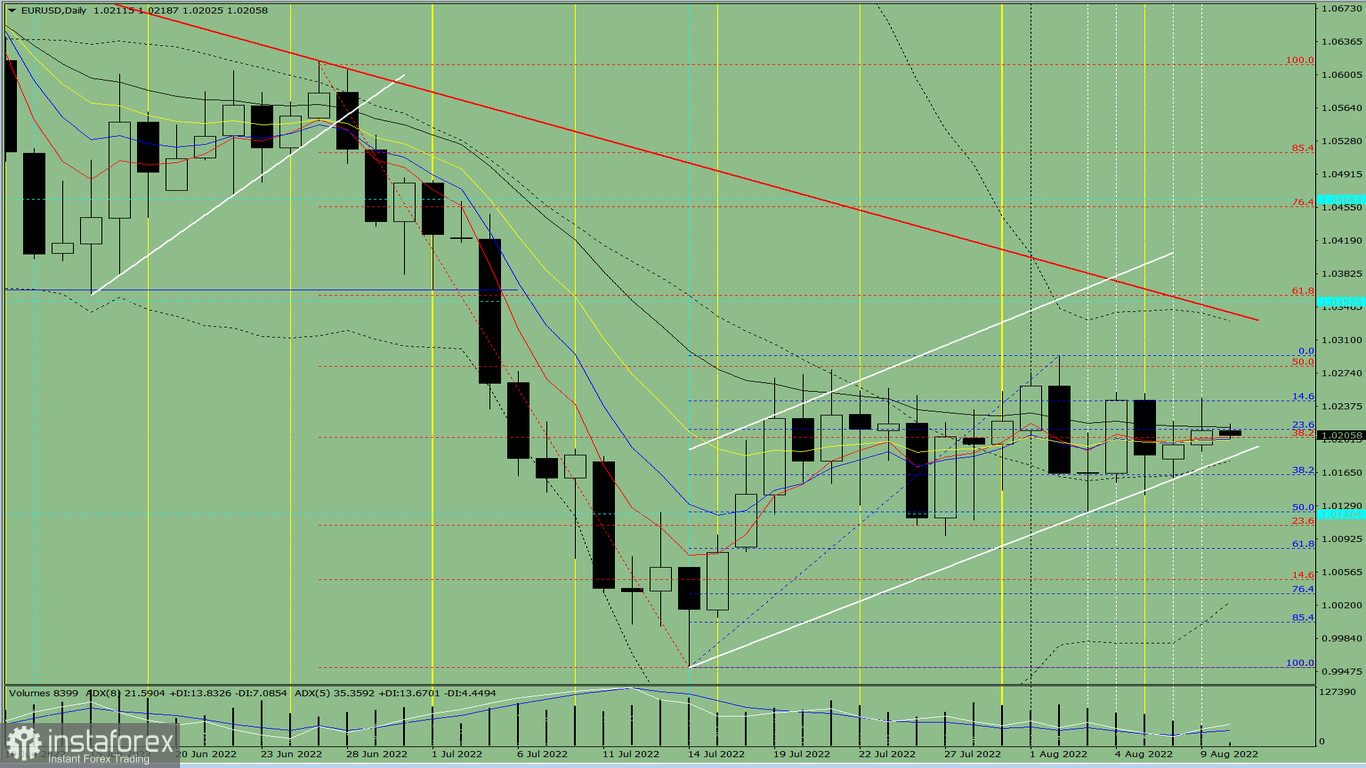
Picture 1: daily chart
Complex analysis
Indicator analysis – upFibonacci levels - up Trading volume – upCandlestick analysis – upTrend analysis – upBollinger bands – upWeekly chart - up
Bottom line
Today, the price could begin a downward move from 1.0211, the closing level of yesterday's daily candlestick, with the target at 1.0181 which coincides with support plotted by the white bold line. Once this level is tested, the price may reverse upwards with the target at 1.0281 which matches the 50.0% Fibonacci retracement plotted by the red dotted line. As soon as this level is reached, the trading instrument will go down again.
Alternative scenario
From 1.0211, the closing level of yesterday's daily candlestick, the currency pair might start a move downwards with the target at 1.0163 which matches the 38.2% Fibonacci retracement plotted by the blue dotted line. After this level is tested, the price could change a trajectory upwards with the target at 1.0281 which coincides with the 50.0% Fibonacci retracement plotted by the red dotted line.
¡Los informes analíticos de InstaForex lo mantendrá bien informado de las tendencias del mercado! Al ser un cliente de InstaForex, se le proporciona una gran cantidad de servicios gratuitos para una operación eficiente.


