 Permanecer
Condiciones de negociación
Products
Herramientas


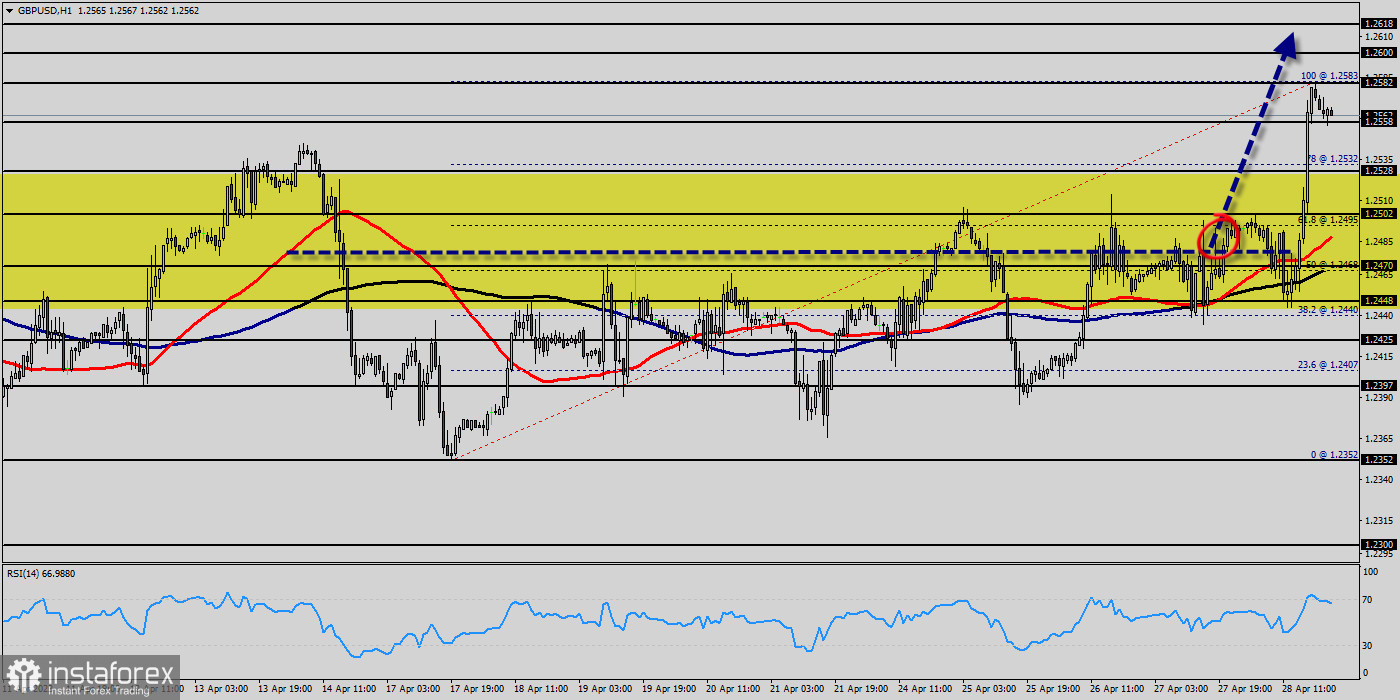
The GBP/USD pair steep decline spells for a capitulation event underway from the levels 1.2470 and 1.2448. More price decline is likely to occur, but traders should consider the bearish thesis event until 1.2502 is broken. The GBP/USD pair dropped sharply from the level of 1.2470 towards 1.2425. Now, the price is set at 1.2425. On the H1 chart, the resistance of GBP/USD pair is seen at the level of 1.2352 and 1.2502. It should be noted that volatility is very high for that the GBP/USD pair is still moving between 1.2425 and 1.2352 in coming hours. Moreover, the price spot of 1.2470 remains a significant resistance zone. Therefore, there is a possibility that the GBP/USD pair will move downside and the structure of a fall does not look corrective; in order to indicate the bearish opportunity below 1.2470, sell below 1.2470 with the first target at 1.2352 so as to test last week's bottom. Also, it should be noticed that support 1 is seen at the level of 1.2352 which coincides the daily double bottom. So, we expect the price to set below the strong resistance at the level of 1.2470; because the price is in a bearish channel now. The RSI starts signaling a downward trend. Consequently, the market is likely to show signs of a bearish trend. Additionally, if the GBP/USD pair is able to break out the bottom at 1.2352, the market will decline further to 1.2312 in order to test the weekly support 2.
The GBP/USD pair steep decline spells for a capitulation event underway from the levels 1.2470 and 1.2448. More price decline is likely to occur, but traders should consider the bearish thesis event until 1.2502 is broken.
The GBP/USD pair dropped sharply from the level of 1.2470 towards 1.2425. Now, the price is set at 1.2425. On the H1 chart, the resistance of GBP/USD pair is seen at the level of 1.2352 and 1.2502. It should be noted that volatility is very high for that the GBP/USD pair is still moving between 1.2425 and 1.2352 in coming hours. Moreover, the price spot of 1.2470 remains a significant resistance zone.
The GBP/USD pair steep decline spells for a capitulation event underway from the levels 1.2470 and 1.2448. More price decline is likely to occur, but traders should consider the bearish thesis event until 1.2502 is broken. The GBP/USD pair dropped sharply from the level of 1.2470 towards 1.2425. Now, the price is set at 1.2425.
On the H1 chart, the resistance of GBP/USD pair is seen at the level of 1.2352 and 1.2502. It should be noted that volatility is very high for that the GBP/USD pair is still moving between 1.2425 and 1.2352 in coming hours.
Moreover, the price spot of 1.2470 remains a significant resistance zone. Therefore, there is a possibility that the GBP/USD pair will move downside and the structure of a fall does not look corrective; in order to indicate the bearish opportunity below 1.2470, sell below 1.2470 with the first target at 1.2352 so as to test last week's bottom. Also, it should be noticed that support 1 is seen at the level of 1.2352 which coincides the daily double bottom.
So, we expect the price to set below the strong resistance at the level of 1.2470; because the price is in a bearish channel now. The RSI starts signaling a downward trend. Consequently, the market is likely to show signs of a bearish trend. Additionally, if the GBP/USD pair is able to break out the bottom at 1.2352, the market will decline further to 1.2312 in order to test the weekly support 2.
Therefore, there is a possibility that the GBP/USD pair will move downside and the structure of a fall does not look corrective; in order to indicate the bearish opportunity below 1.2470, sell below 1.2470 with the first target at 1.2352 so as to test last week's bottom.
Also, it should be noticed that support 1 is seen at the level of 1.2352 which coincides the daily double bottom. So, we expect the price to set below the strong resistance at the level of 1.2470; because the price is in a bearish channel now.
The RSI starts signaling a downward trend. Consequently, the market is likely to show signs of a bearish trend. Additionally, if the GBP/USD pair is able to break out the bottom at 1.2352, the market will decline further to 1.2312 in order to test the weekly support 2.
¡Los informes analíticos de InstaForex lo mantendrá bien informado de las tendencias del mercado! Al ser un cliente de InstaForex, se le proporciona una gran cantidad de servicios gratuitos para una operación eficiente.


