 Permanecer
Condiciones de negociación
Products
Herramientas


On Thursday, EUR/USD went upwards again which cannot be explained by anything. The market carried on selling the US dollar. Previously, we tried to puzzle out what response the market could give to policy decisions of major central banks. Nowadays, such predictions and reasoning make no sense. With all due respect to Jerome Powell who frequently appears with public remarks, the content of his comments remains roughly the same. Therefore, we discussed a few times that EUR/USD's rally in the last few weeks contradicts any logic. Now we can say that we watched EUR/USD's growth without any obvious reasons on Thursday. Today, on Friday, the currency pair sharply tumbled because the actual employment growth in the US nonfarm payrolls was much stronger than expected. Nevertheless, the currency pair might close the trading week anywhere. We wouldn't be surprised if the US dollar weakens again by the closing bell because the market seems to have forgotten the sell button.
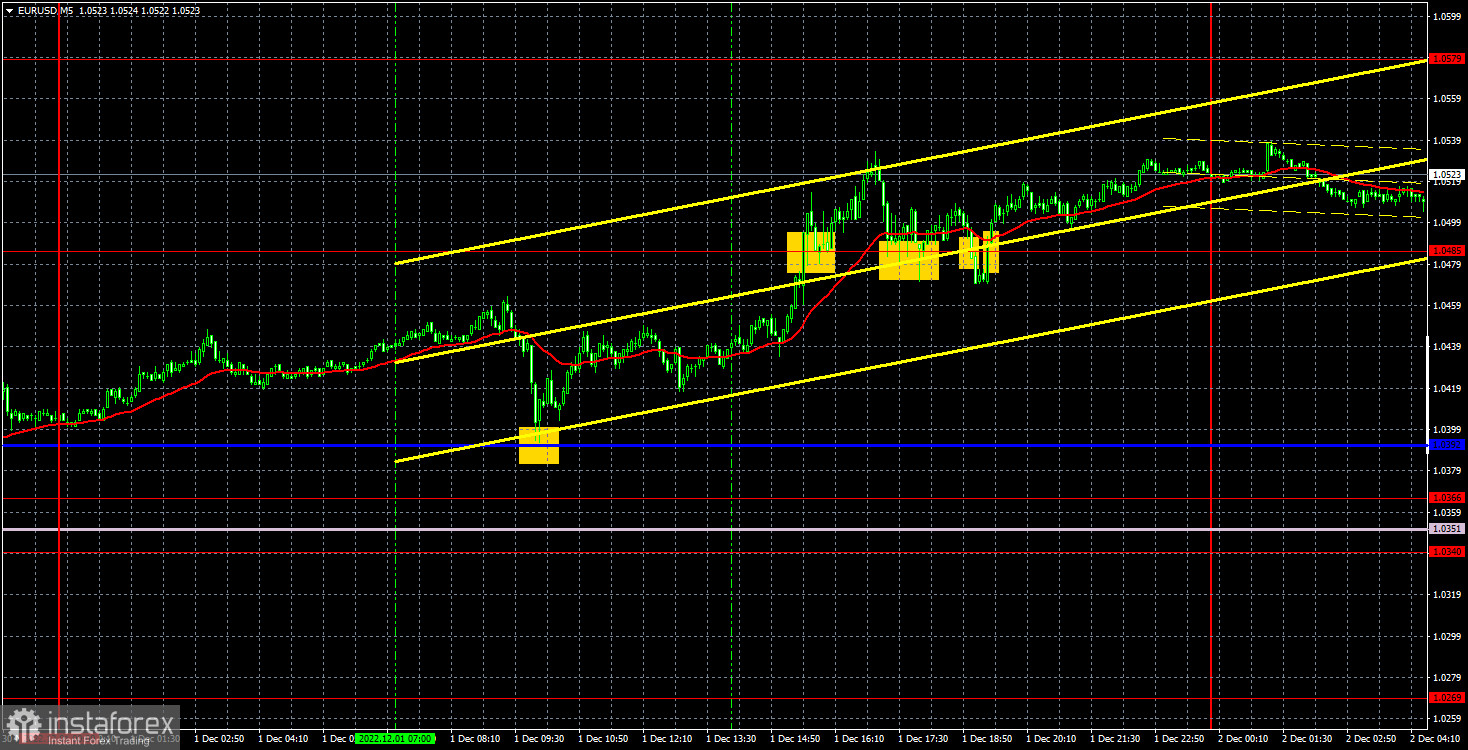
The currency pair generated clear trading signals on Thursday. The first signal was firmed at around the critical level with a minor deviation. After a drop off Kijun-sen, the instrument went up and surpassed the level of 1.0485. It has not been able to settle below it until the evening. So, we had to close the only trade above this level manually. The profit gained measures about 80-90 pips.
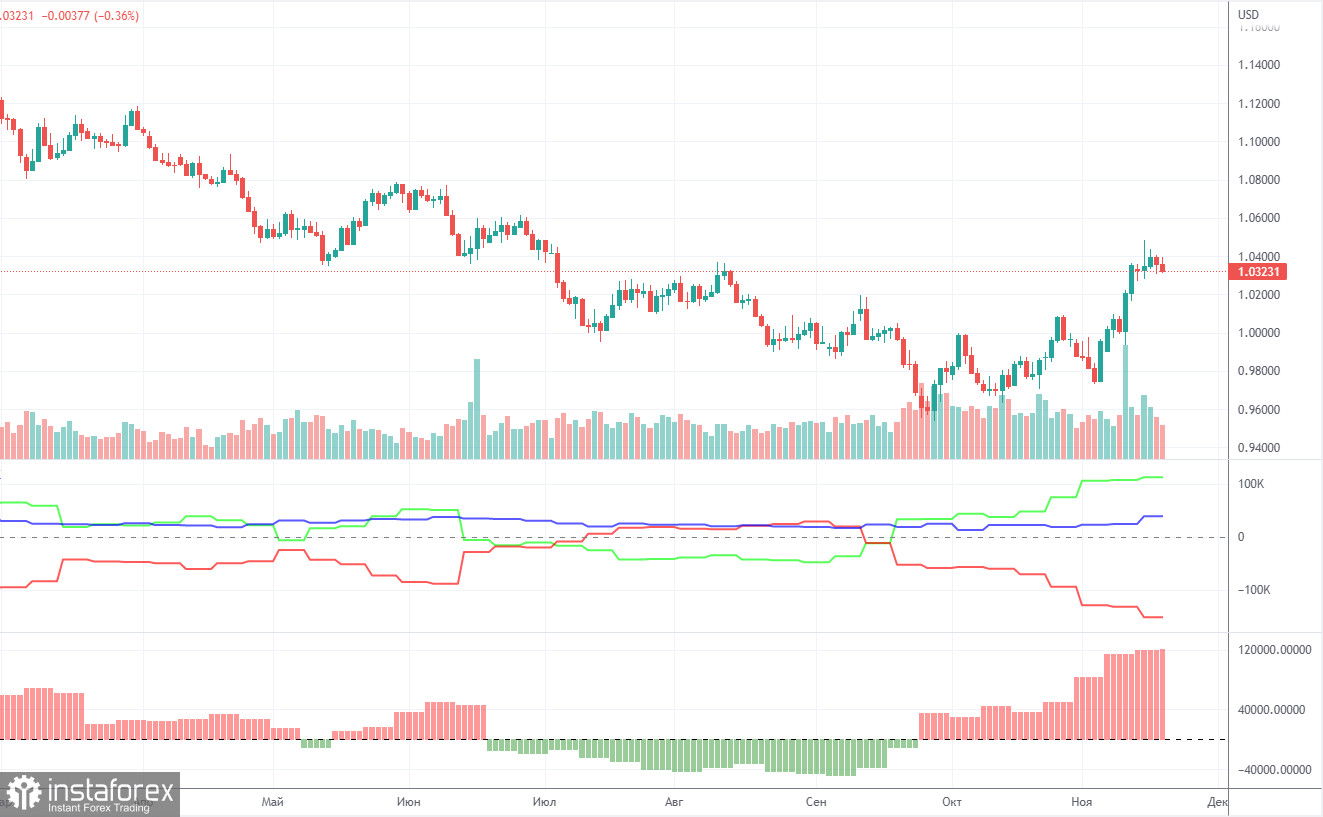
COT reports on EUR/USD have puzzled traders through most of 2022. Half of the year, COT reports indicated clear-cut bullish sentiment among large market makers while the single European currency was extending its weakness. For a few months, the reports showed a bearish sentiment and the euro was also trading lower. Now sentiment of non-commercial traders is turning bullish again, but the euro could hardly rebound off its 20-year lows. This happens because demand for the US dollar remains buoyant amid geopolitical jitters. Therefore, even though demand for the euro is growing, the US dollar's high demand puts a lid on the euro's climb.
During the reporting week, the number of Buy contracts for the Non-commercial group increased by 7,000, and the number of short contracts rose by 2,000. Accordingly, the net position grew by about 5,000 contracts. The European currency has been rising slowly but surely in recent weeks, which is already in line with the readings of the COT reports. At the same time, we believe that the US currency may still regain its footing amid the same geopolitics or due to the lack of fundamentals for further growth of the euro. The green and red lines of the first indicator moved far away from each other, which could mean the end of the uptrend (!!!) (which, in fact, never happened).
The number of BUY contracts is higher than the number of SELL contracts for non-commercial traders by 113K. Thus, the net position of the "Non-commercial" group may continue to rise further, but this may not trigger a similar rise in the euro. If we look at the overall numbers of open long and short contracts for all categories of traders, there are 39k more sell contracts (635k vs 596k).
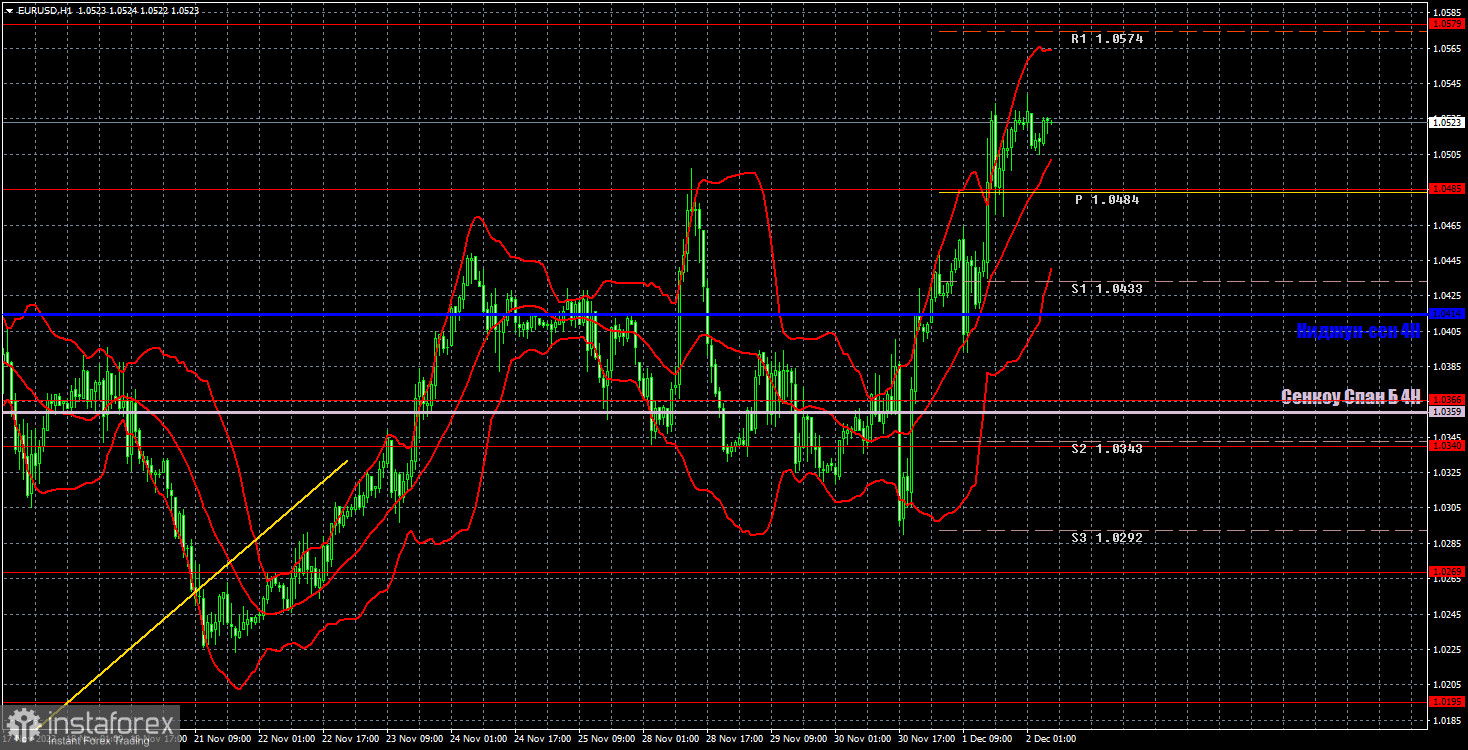
On the hourly timeframe, EUR/USD continues to show absolutely erratic movements, and yesterday is just another proof of this. After the ascending trend line was broken, the downward movement did not actually begin. After Jerome Powell's speech, the pair returned to its local peaks for absolutely no reason. Yesterday, the price easily overcame the peaks, although there were no special reasons for this. On Friday, we highlight the following levels for trading - 1.0124, 1.0195, 1.0269, 1.0340-1.0366, 1.0485, 1.0579, 1.0637, as well as Senkou Span B (1, 0359) and Kijun-sen (1.0414). Ichimoku indicator lines can move during the day, which should be taken into account when determining trading signals. There are also auxiliary support and resistance levels, but no signals are formed near them. Signals could indicate a bounce or drop and overcoming extreme levels and lines. Do not forget about placing a Stop Loss order at breakeven if the price has gone in the right direction for 15 points. This will safeguard you from possible losses if the signal turns out to be false. On December 2, Christine Lagarde's already delivered her speech in the European Union. All the statistics were published in the US, after which the dollar eventually perked up. It remains to be seen where this week closes.
Explanations of the illustrations:
Price levels of support and resistance are plotted by thick red lines, near which the movement can end. They are not sources of trading signals.
The Kijun-sen and Senkou Span B lines are the Ichimoku indicator lines transferred to the hourly timeframe from the 4-hour timeframe. They are strong lines.
Extreme levels are thin red lines, from which the price bounced earlier. They are sources of trading signals.
Yellow lines represent trend lines, trend channels, and any other technical patterns.
Indicator 1 on the COT charts is the size of the net position of each category of traders.
Indicator 2 on the COT charts is the size of the net position for the Non-commercial group.
¡Los informes analíticos de InstaForex lo mantendrá bien informado de las tendencias del mercado! Al ser un cliente de InstaForex, se le proporciona una gran cantidad de servicios gratuitos para una operación eficiente.


