 Permanecer
Condiciones de negociación
Products
Herramientas


Trend analysis
EUR/USD may continue its upward movement this week, starting from the level of (closing of the last weekly candle) to 1.0695, which is the historical resistance level (blue dotted line). Upon reaching this, the pair is likely to head towards the upper fractal at 1.0785 (yellow dashed line), then rebound downwards.
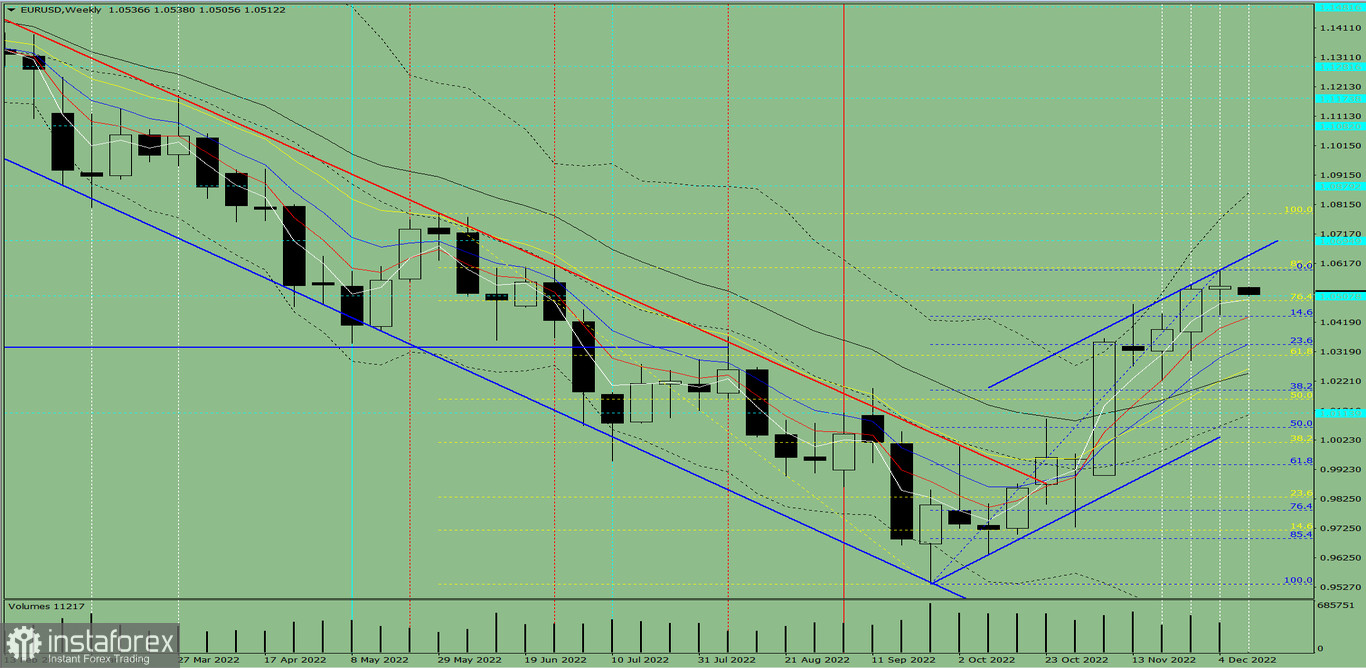
Fig. 1 (weekly chart)
Comprehensive analysis:
Indicator analysis - uptrend
Fibonacci levels - uptrend
Volumes - uptrend
Candlestick analysis - downtrend
Trend analysis - uptrend
Bollinger bands - downtrend
Monthly chart - uptrend
All this points to an upward movement in EUR/USD.
Conclusion: The pair will have a bullish trend, with a first lower shadow on the weekly white candle (Monday - down) and a second lower shadow (Friday - down).
So during the week, euro will rise from 1.0541 (closing of the last weekly candle) to the historical resistance level at 1.0695 (blue dotted line), go to the upper fractal at 1.0785 (yellow dashed line), then rebound downwards.
Alternatively, the quote could go up from 1.0541 (closing of the last weekly candle) to the resistance line at 1.0645 (blue dotted line), followed by a fall to the 14.6% retracement level at 1.0438 (blue dotted line).
¡Los informes analíticos de InstaForex lo mantendrá bien informado de las tendencias del mercado! Al ser un cliente de InstaForex, se le proporciona una gran cantidad de servicios gratuitos para una operación eficiente.


