 Permanecer
Condiciones de negociación
Products
Herramientas

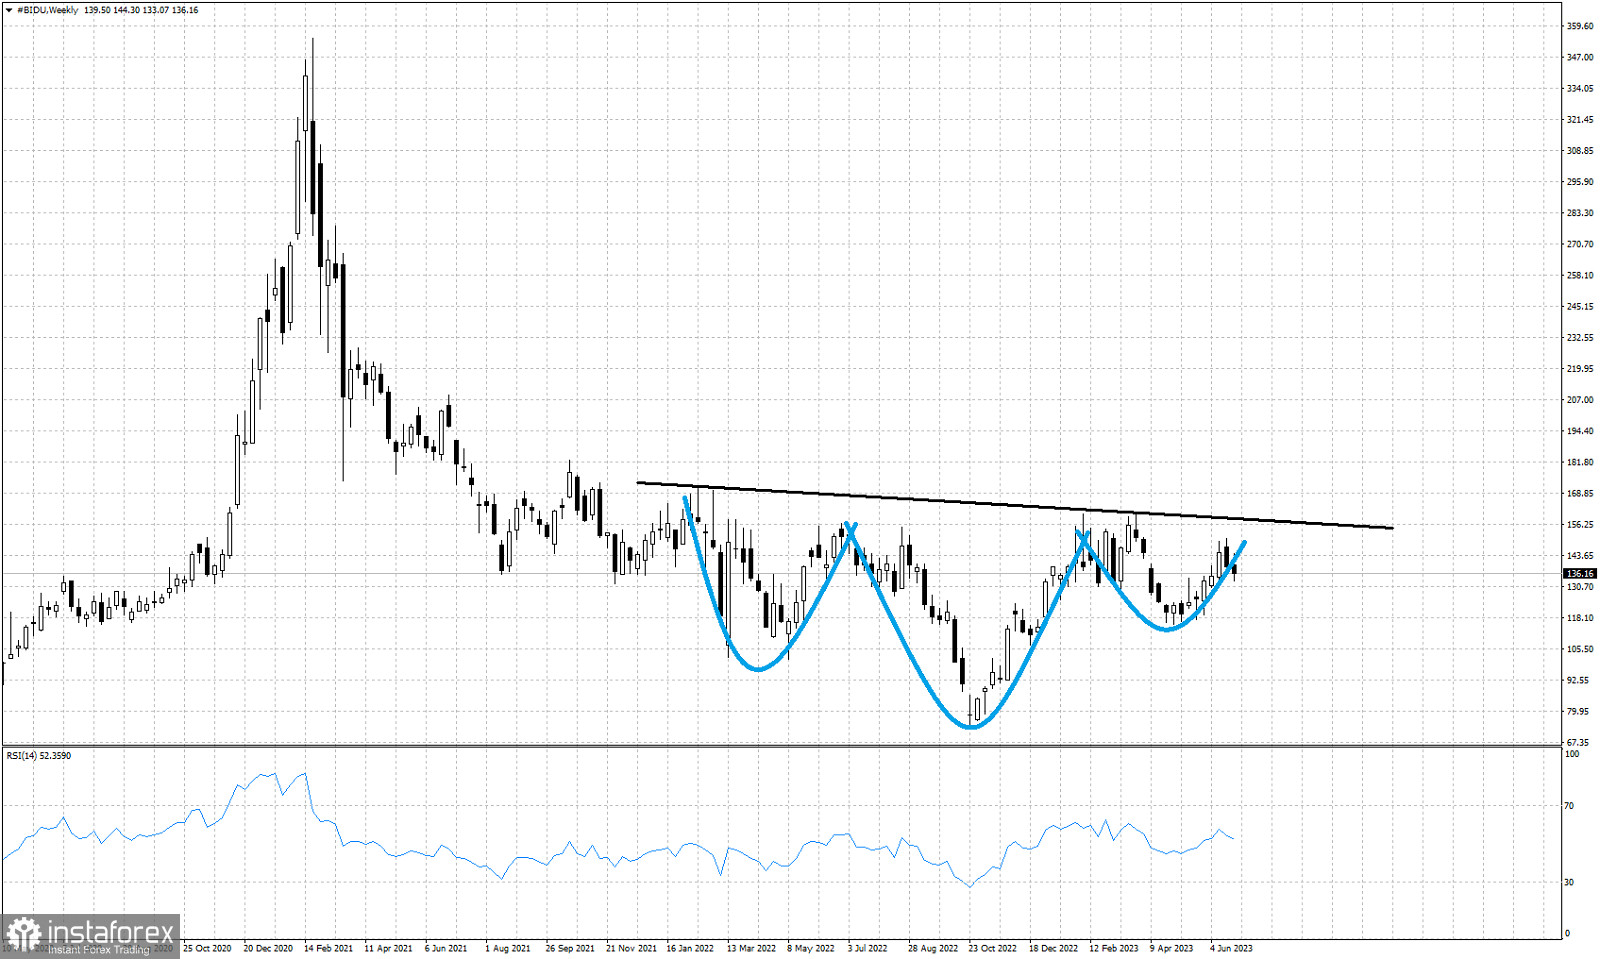
Black line- neckline resistance
Blue lines- Head and Shoulders pattern
The Bidu stock price is trading around $136. Price has mostly been moving sideways over the last 2 years. Today we focus on the inverted head and shoulders pattern it has formed in the weekly chart. The neckline resistance is found at $158-$159 and a weekly close above this level will activate this bullish pattern. If the pattern is activated then we will have $240-$250 as a target. Support is at the right hand shoulder low of $115. A break below this level cancels this scenario.
¡Los informes analíticos de InstaForex lo mantendrá bien informado de las tendencias del mercado! Al ser un cliente de InstaForex, se le proporciona una gran cantidad de servicios gratuitos para una operación eficiente.


