 Permanecer
Condiciones de negociación
Products
Herramientas


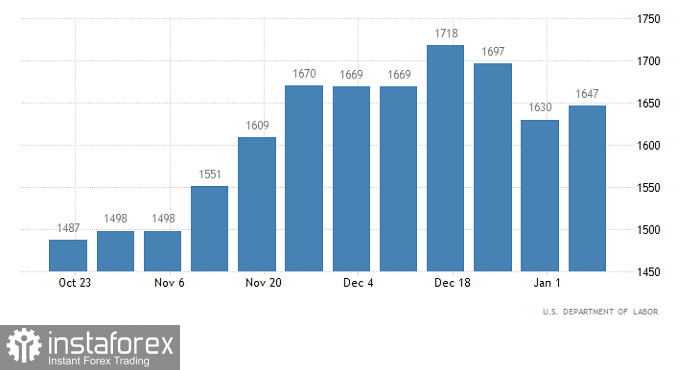
The multidirectional nature of the unemployment claims data in the United States was the main reason why the currency market is stagnant. Initial claims for state unemployment benefits dropped 15,000, although it should have increased by 2,000. However, if the data on initial applications turned out to be noticeably better than forecasted, the situation with repeated applications is diametrically opposite. According to forecasts, the so-called continuing claims should have grown by 6,000, but in fact it rose 17,000. Nevertheless, the total number of applications increased by 2,000, i.e. remained virtually unchanged. And as we can see from the forecasts, it was supposed to grow by 8,000. Well, the final data themselves were slightly better than forecasted.
The number of jobless claims (United States):
Today the macroeconomic calendar is completely empty, so it will probably be another stage of a flat market. And this may last till Thursday, when preliminary data on US GDP will be released. In the meantime, not much interesting macro data is expected.
The EURUSD pair has been moving in the sideways range at the peak of the upward cycle all through the trading week. This price move indicates the process of accumulation of trading forces, otherwise the market would have already had a corrective move, which was brewing at the beginning of the week.
On the four-hour chart, the RSI technical indicator is moving along the mid line 50, which corresponds to stagnation. On the D1 chart, the RSI is at 64, which points to the bullish sentiment among traders.
Moving averages on the H4 Alligator are intersected with each other which means sideways trading. On the daily chart, moving averages are directed upward which corresponds to the overall bullish cycle.

Outlook and trading ideas
Based on the structure and the price movement, we can assume that the current flat is ending. A prolonged stagnation may serve as a lever for new speculative price spikes.
The optimal strategy to consider is the method of outgoing momentum, which in the theory of technical analysis can indicate the subsequent direction of the price.
Complex indicator analysis suggests mixed signals for the short-term and intraday trading on the back of the flat market. The overall bullish sentiment is still valid for the medium term.
¡Los informes analíticos de InstaForex lo mantendrá bien informado de las tendencias del mercado! Al ser un cliente de InstaForex, se le proporciona una gran cantidad de servicios gratuitos para una operación eficiente.


