 Permanecer
Condiciones de negociación
Products
Herramientas


On Thursday, the United States saw the release of the first Q4 GDP estimate. Economic growth slowed to 1.0% from 1.9%, well below the market forecast of 1.6%. These are growing signs of a looming recession in the United States. Nevertheless, the market ignored those results. Rather, it was focused on the quarterly GDP report that revealed a 2.9% increase, up from the expected 2.7%. Despite an annual slowdown in economic activity, quarterly data shows that the country may avoid a recession.
As for weekly jobless claims, first-time claims dropped to 186,000 from 192,000 and continuing ones rose to 1,640 million versus 1,647 million.

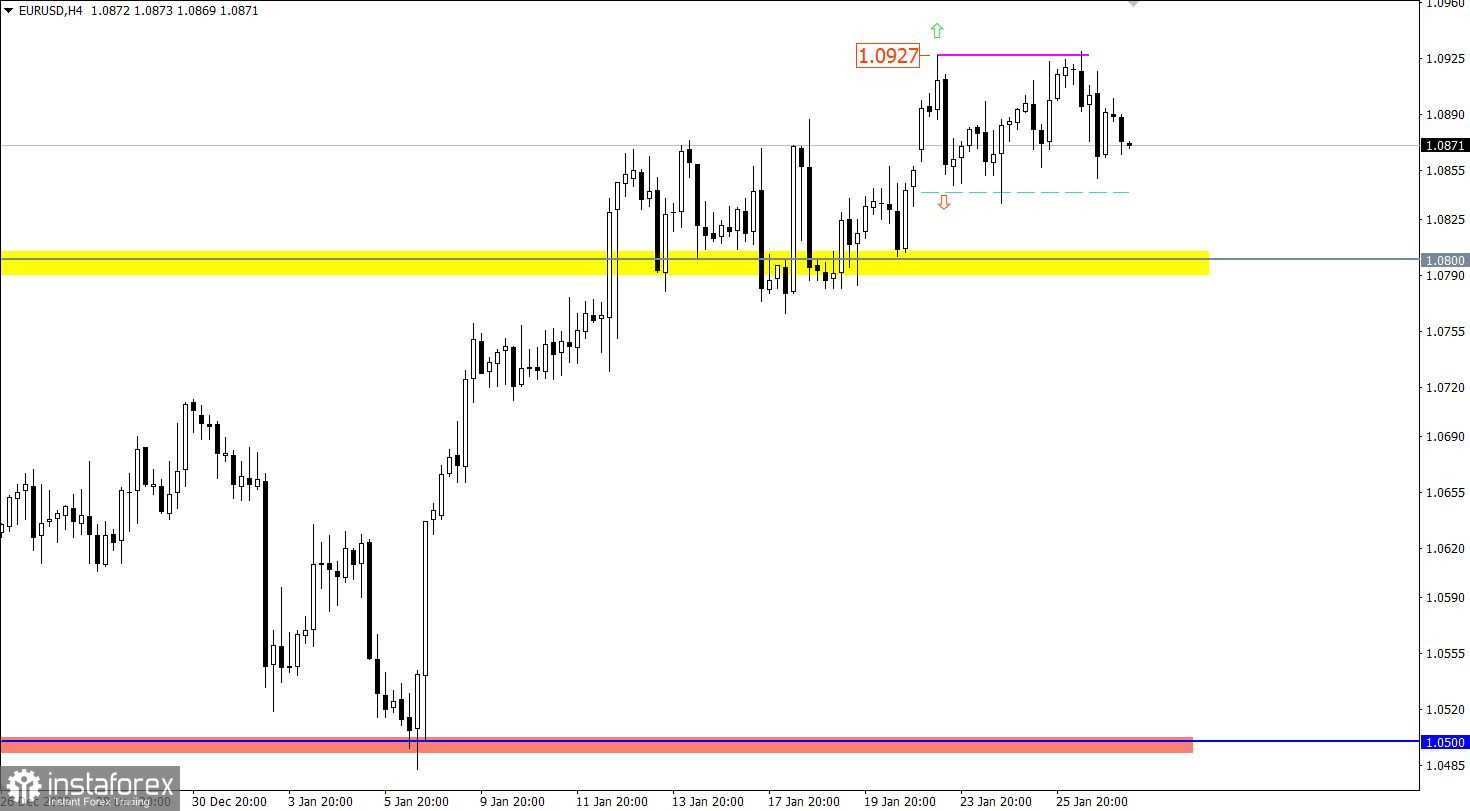
Since Monday, the EUR/USD pair has been moving in a sideways channel of 1.0840/1.0930 with periodic fluctuations. On the one hand, there is a slowdown in the uptrend. On the other hand, due to the lack of a fully-fledged correction, sentiment remains bullish.
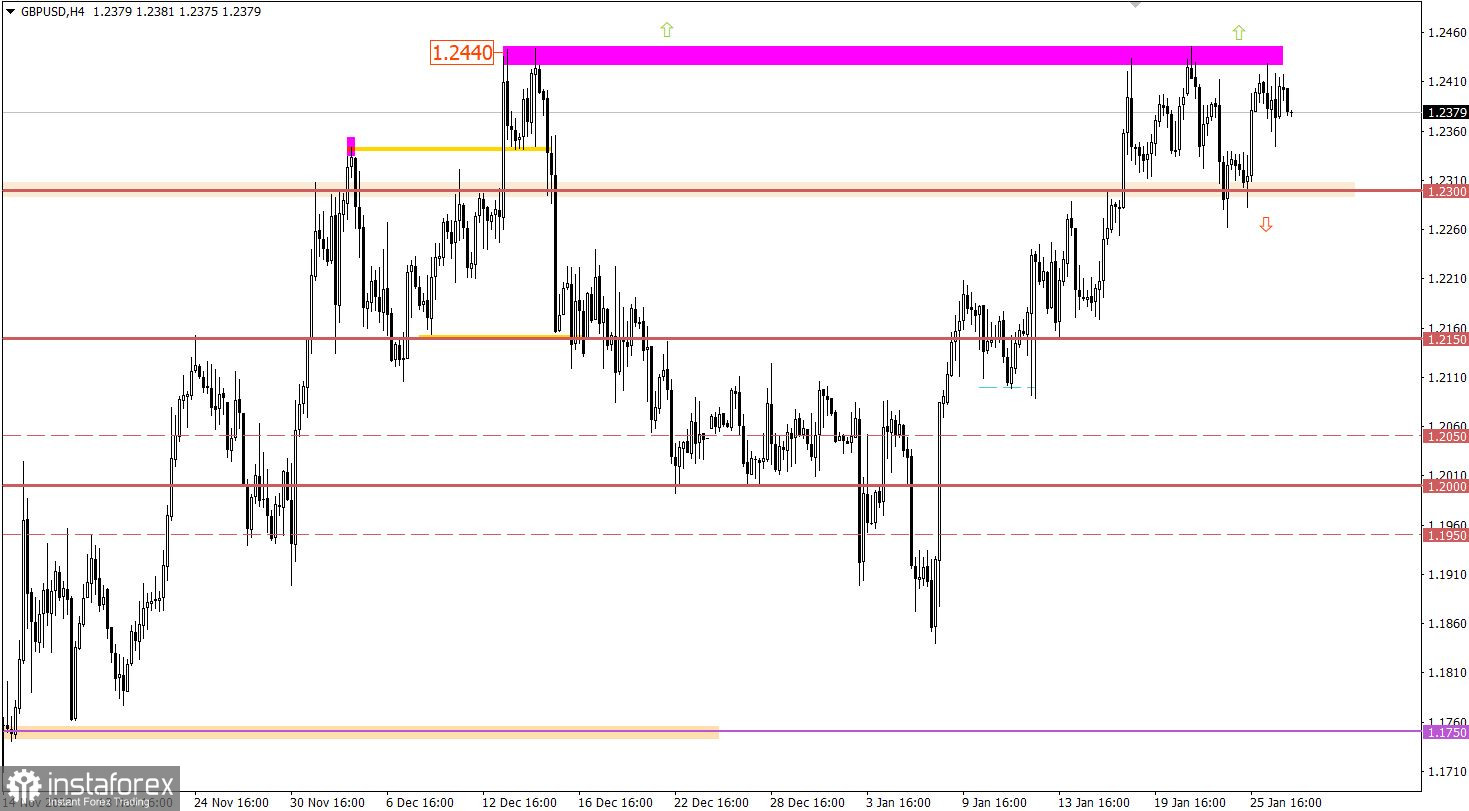
Despite a clear bullish bias, the GBP/USD pair did not update the swing high. Eventually, the level of 1.2440 became resistance. The price has repeatedly come to a standstill/rebounded there.
Today, the macroeconomic calendar is empty with no important releases scheduled in the United Kingdom, the eurozone, and the United States. Therefore, traders will be digesting the macro results that came on Thursday, with an additional focus on reports from the media.
At this point, it is essential to pay attention to the medium-term trend and the movement of the price within a week. It is about a flat market that may trigger speculative activity. In such a case, the end of the flat in the market will mark the beginning of an impulsive move.
Possible scenarios:
The pair will go up in case of consolidation above 1.0940 in the 4-hour time frame. The target stands at the psychological level of 1.1000.
However, if the quote settles below 1.0840 in the 4-hour time frame, it may then head toward 1.0800, marking the beginning of a fully-fledged correction.
Taking into account weekly price swings, the pair is now trading in a sideways channel of 1.2300/1.2440. This horizontal movement at the peak of the uptrend could be seen as an accumulation stage, which may lead to an impulsive move.
Possible scenarios:
A downtrend is likely if the pair consolidates below 1.2300 in the 4-hour time frame. A fully-fledged correction may occur afterward.
A bullish continuation is likely after settling above 1.2450 in the 4-hour time frame.
The candlestick chart shows graphical white and black rectangles with upward and downward lines. While conducting a detailed analysis of each individual candlestick, it is possible to notice its features intrinsic to a particular time frame: the opening price, the closing price, and the highest and lowest price.
Horizontal levels are price levels, in relation to which a stop or reversal of the price may occur. They are called support and resistance levels.
Circles and rectangles are highlighted examples where the price reversed in the course of its history. This color highlighting indicates horizontal lines which can exert pressure on prices in the future.
Upward/downward arrows signal a possible future price direction.
¡Los informes analíticos de InstaForex lo mantendrá bien informado de las tendencias del mercado! Al ser un cliente de InstaForex, se le proporciona una gran cantidad de servicios gratuitos para una operación eficiente.


