 Permanecer
Condiciones de negociación
Products
Herramientas

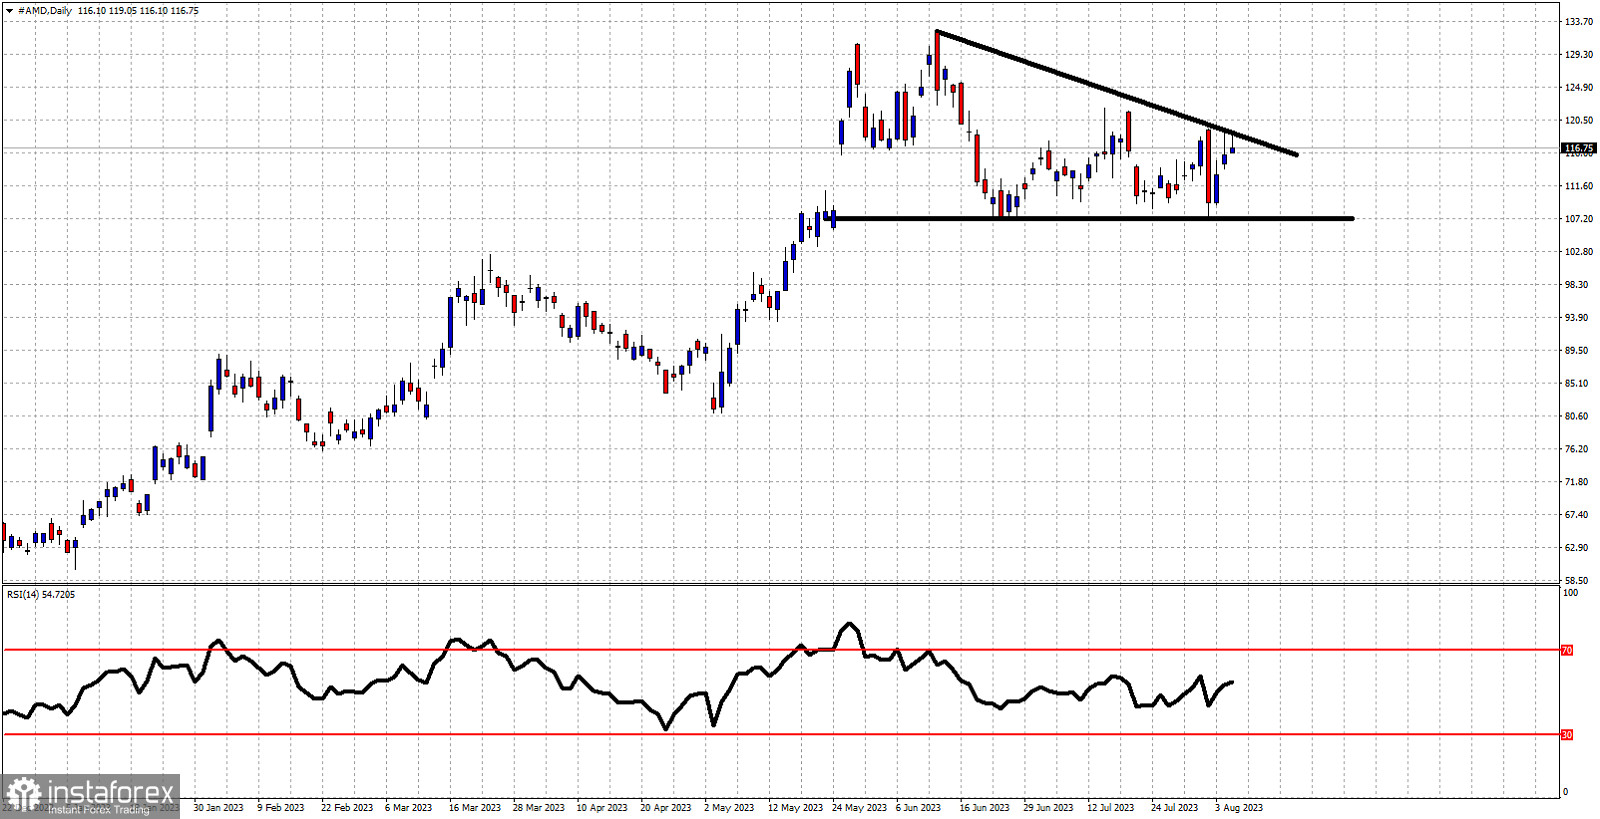
Black lines- triangle pattern
AMD stock price is trading around $117. Price is forming lower highs but the lows continue to respect the $107 level. Price has formed a descending triangle pattern. Price is now challenging the upper triangle boundary. AMD stock price has resistance at $118.80 and support at $107. There is still room for sideways movement inside the triangle pattern until the end of the month. If however price breaks below $107 we should expect more selling pressures to push price towards $90. If resistance at $118.80 is broken, we should at least expect a challenge of the highs at $132. With price just below the resistance of $118.80, at current levels we prefer to be bearish because chances of a rejection are high. We remain bearish as long as price is below $118.80.
¡Los informes analíticos de InstaForex lo mantendrá bien informado de las tendencias del mercado! Al ser un cliente de InstaForex, se le proporciona una gran cantidad de servicios gratuitos para una operación eficiente.


